About NCL color tables
There are a large number of predefined color tables that come with NCL. These are ASCII files with RGB values, installed in the directory $NCARG_ROOT/lib/ncarg/colormaps. You can edit any one of these color tables using a UNIX editor to create your own color table.In NCL Version 6.2.0, over one hundred new color tables were added from ColorBrewer, GMT, GrADS, matplotlib, and Ncview. Most of these were contributed by Nicolas Barrier, Melissa Bukovsky, and Carl Schreck.
The default predefined color table (added in NCL V6.1.0), called "ncl_default", has 256 colors (including background and foreground colors). The old default color table was called "default" and had 32 colors.
| Current default color table | Old default color table | ||
|---|---|---|---|
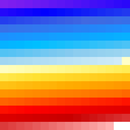
|
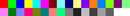
|
If you have a predefined NCL color table that you use often, you can add this line to your .hluresfile:
*wkColorMap : colormap_name
where colormap_name is the name of the color table, for example,
BlueWhiteOrangeRed. This
color table will be the new default every time you run NCL.
You can create your own color table file and place it where NCL can load it directly. You can also use predefined named colors, or create your own color table inside an NCL script using an RGB or RGBA array. For some examples, see the colormap page in the application examples.
For your convenience, you can download all of the most recent color tables as a tar file. Untar this file in the $NCARG_ROOT/lib/ncarg/colormaps directory, or in your own personal directory and setenv NCARG_COLORMAPS to this directory.
Nicolas Barrier provided a svgtocmap.ncl NCL script for converting various colormaps from http://soliton.vm.bytemark.co.uk/pub/cpt-city/ to NCL RGB colormaps. Many of these are included in the V6.2.0 release.
Of related interest, there's an interesting article on improving color maps for scientific visualizations entitled "The End of the Rainbow? Color Schemes for Improved Data Graphics". Click on the PDF file to download the article, or view some of the PNG files for comparisons of color maps.
Groupings
- rainbow
- tables for help with color blindness and color deficient viewers
- color tables used by MeteoSwiss
- white in middle
Application Examples
- using named colors
- reverse color table
- CMYK
- using RGB triplets
- HSV
- changing foreground/background colors
- retrieving the RGB triplets of the colormap
Code Snippets
;---Using the color map to define colors for contours or vectors
  res@cnFillPalette = "BkBlAqGrYeOrReViWh200"
  res@vcLevelPalette = "BkBlAqGrYeOrReViWh200"

;---Reading the colormap into an N x 4 (RGBA) array
  cmap = read_colormap_file("ncl_default")

;---Using the color map to define a color map for the workstation
  gsn_define_colormap(wks,"BlueYellowRed")
Acknowledgments
Several people have contributed color tables to NCL over the years:
- Adam Phillips, NCAR
- Nicolas Barrier, Laboratoire de Physique des Oceans
- Professor Patrick J. Bartlein, Dept. of Geography, University of Oregon
- Melissa Bukovsky, NCAR
- John Fasullo, NCAR
- Oliver Fuhrer, MeteoSwiss
- Joe Grim, NCAR
- Andrea Hahmann
- Matthew Long, NCAR
- Dennis Shea, NCAR
- Emilie Vanvye, NAR