geolocation_circle
Create latitudes and longitudes that define concentric circles at user specified distances from a central location.
 Available in version 6.5.0 and later.
Prototype
load "$NCARG_ROOT/lib/ncarg/nclscripts/csm/contributed.ncl"  ; This library is automatically loaded
                                                             ; from NCL V6.2.0 onward.
                                                             ; No need for user to explicitly load.

	function geolocation_circle (
		clat [*] : numeric,
		clon [*] : numeric,
		crad [*] : numeric,
		urad [1] : integer,
		N    [1] : integer,
		opt  [1] : logical
	)

	return_val  :  float or double
Arguments
clatclon
Scalars or one-dimensional arrays containing the 'center' location latitudes or latitudes. If these are arrays,they must be the same length. Missing values are not allowed.
Most commonly, these might be station or grid point locations or a time series of (say) low-pressure center locations.
cradScalar or one-dimensional array containing the radial distances for each circle. The units can be degrees (great circle degrees) or kilometers (km).
uradAn integer which specifies the units of crad: =0 means degrees (dg); =1 mean kilometers (km)
optCurrently, not used. Set to False.
Return value
A variable of type list containing two variables (say, Rlat and Rlon) which contain the geolocated latitudes and longitudes for each specified location pair at each radius.
       Rlat(dimsizes(clat),dimsizes(crad),N),
       Rlon(dimsizes(clat),dimsizes(crad),N)).
Informational attributes are also returned.
Description
geolocation_circle computes N latitude and longitudes at each specified crad. The nggcog is used for the computations.
The gc_inout function can be used to retain or exclude values within the radii. Some examples of using gc_inout for this purpose are at:
- Katrina_circle
- shapefiles: Examples 5, 9 and 13
See Also
Examples
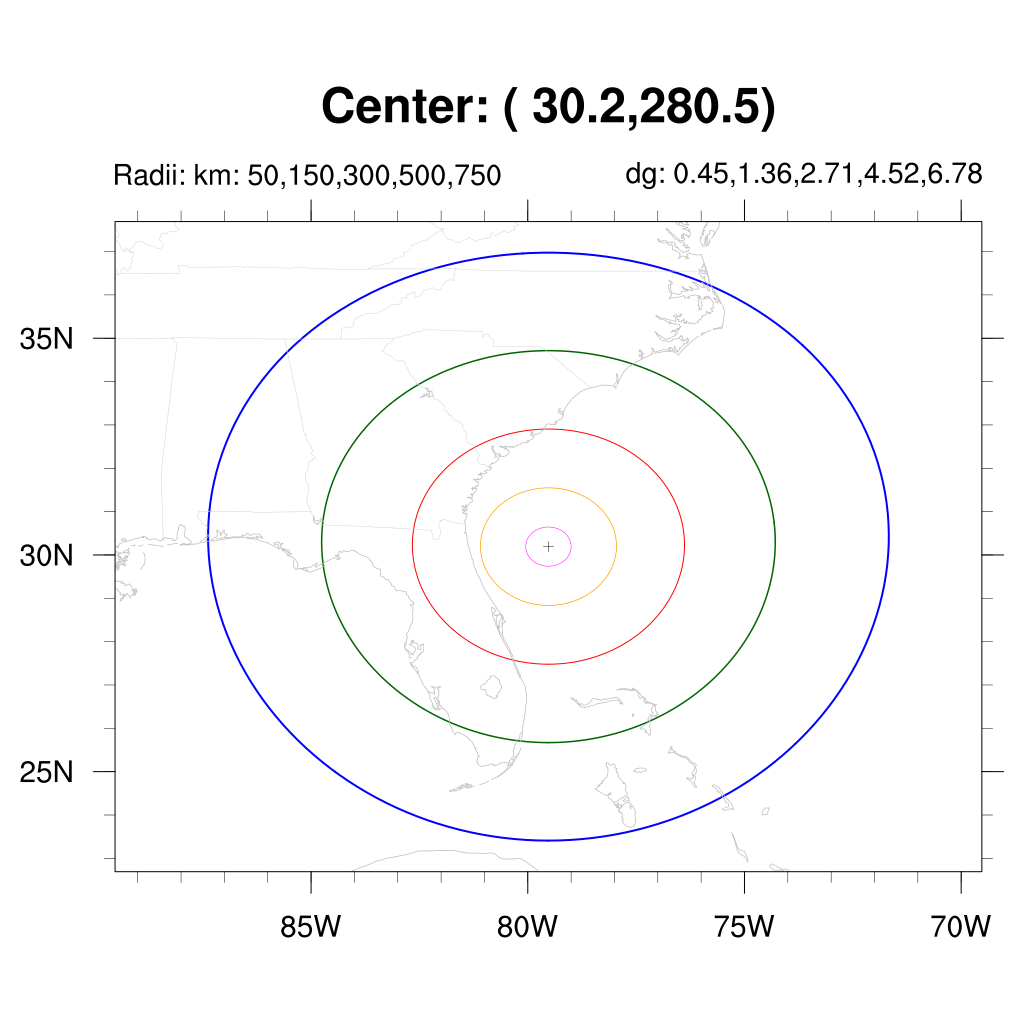
Example 1: The plot created by the following script is here.
; *********************************
; Draw circles
;**********************************

;---One station with multiple radii

    slat      =   30.192                     ; lat: station or storm
    slon      =  280.477                     ; lon: station or storm
    srad      = (/ 50, 150, 300, 500, 750/)  ; station radii (km)
    srad_unit = 1                            ; km
    N         = 180                          ; # of points; more points nicer 'circle'
    opt       = False
;---End input

    nLoc = dimsizes(slat)                   ; # locations
    nRad = dimsizes(srad)                   ; # radii

    circle    = geolocation_circle(slat, slon, srad, srad_unit, N, opt) ; circle is type list

;---Extract variables from 'list'
    printVarSummary(circle)
    circle_lat = circle[0]                   ; clarity: explicitly extract list variables
    circle_lon = circle[1]

;---Print and examine returned variables
    printVarSummary(circle_lat)
    print("------------------")
    printVarSummary(circle_lon)
    print("------------------")

;---Print the lat/lon for the last radius [ for fun ]
    print(circle_lat(nRad-1,:)+"  "+circle_lon(nRad-1,:))

;*************************************************
; Plot
;*************************************************

    pltType          = "png"
    pltDir           = "./"
    pltName          = "geolocation_circle"
    pltPath          = pltDir + pltName

;---Resources for background map
    res              = True
    res@gsnDraw      = False
    res@gsnFrame     = False
    res@gsnMaximize  = True

   ;res@mpProjection = "CylindricalEquidistant"            ; choose map projection
   ;res@mpLimitMode  = "LatLon"
    res@mpOutlineBoundarySets  = "GeophysicalAndUSStates"   ; add state boundaries
    res@mpGeophysicalLineColor = "Gray"
    res@mpUSStateLineColor     = "LightGray"
    res@mpMinLatF    = slat - 7.5                          ; add 'buffer' around central location
    res@mpMaxLatF    = slat + 7.5
    res@mpMinLonF    = slon - 10
    res@mpMaxLonF    = slon + 10
    res@mpCenterLonF = (res@mpMinLonF  + res@mpMaxLonF )*0.5
    res@mpGeophysicalLineThicknessF  = 1.5
    res@mpFillOn                     = False

;--Text for map
    res@tiMainString   = "Center: ("+sprintf("%5.1f", slat)+","+sprintf("%5.1f", slon)+")"

    res@gsnStringFontHeightF = 0.0125
    res@gsnLeftString  = "Radii: km: "
    res@gsnRightString = "dg: "
    do nr=0,nRad-2
       res@gsnLeftString  = res@gsnLeftString  + sprinti("%2.2i", srad(nr))+","
       res@gsnRightString = res@gsnRightString + sprintf("%4.2f", circle_lat@radii_converted_values(nr) )+","
    end do
    res@gsnLeftString  = res@gsnLeftString  + sprinti("%2.2i", srad(nRad-1))
    res@gsnRightString = res@gsnRightString + sprintf("%4.2f", circle_lat@radii_converted_values(nRad-1) )

;*****************************************************
;               Plot
;*****************************************************

    wks  = gsn_open_wks(pltType, pltPath)
    plot = gsn_csm_map(wks,res)       ; draw background map

    plres  = True
    plres@gsMarkerIndex = 2           ; Plus sign ( + )
   ;plres@gsMarkerIndex = 15          ; Circle with x
   ;plres@gsMarkerIndex = 16          ; Filled Circle
    plres@gsMarkerSizeF = 10.
    plres@gsMarkerColor = "black"
    plot@$"marker"$     = gsn_add_polymarker(wks, plot, slon, slat, plres) ; "marker" is arbitrary

    colors = (/ "magenta", "orange", "red", "DarkGreen", "blue"  /)
    thick  = (/    1     ,  1.5    ,  2.0 ,   3.0      ,   4.0   /)

    do nl=0,nLoc-1
      do nr=0,nRad-1
         plres@gsLineColor      = colors(nr)
         plres@gsLineThicknessF = thick(nr)
         circ_id = "radii_"+nl+"_"+nr           ; any unique name
         plot@$circ_id$ = gsn_add_polyline(wks, plot, circle_lon(nl,nr,:), circle_lat(nl,nr,:), plres)
      end do       ; nr
    end do         ; nl

    draw(plot)
    frame(wks)
------------------------------------------------------------------------- The (edited) output follows:
          Variable: circle
          Type: list
          Total items: 2


          Variable: circle_lat
          Type: float
          Total Size: 3600 bytes
                      900 values
          Number of Dimensions: 2
          Dimensions and sizes:	[location | 1] x [radii | 5] x [circle | 180]
          Coordinates:
          Number Of Attributes: 7
            units :	degrees_north
            long_name :	circle latitudes
            radii_converted_values :	( 0.4522022, 1.356607, 2.713213, 4.522022, 6.783033 )
            radii_converted_units :	great_circle_degrees
            radii_input_values :	( 50, 150, 300, 500, 750 )
            radii_input_units :	km
            _FillValue :	9.96921e+36

          ------------------

          Variable: circle_lon
          Type: float
          Total Size: 3600 bytes
                      900 values
          Number of Dimensions: 2
          Dimensions and sizes:	[location | 1] x [radii | 5] x [circle | 180]
          Coordinates:
          Number Of Attributes: 7
            units :	degrees_east
            long_name :	circle longitudes
            radii_input_units :	km
            radii_input_values :	( 50, 150, 300, 500, 750 )
            radii_converted_units :	great_circle_degrees
            radii_converted_values :	( 0.4522022, 1.356607, 2.713213, 4.522022, 6.783033 )
            _FillValue :	9.96921e+36

        ------------------

          (0)	23.409   -79.523
          (1)	23.4129  -79.2642
          (2)	23.4247  -79.0057
          (3)	23.4443  -78.7477
          (4)	23.4717  -78.4905
          (5)	23.5069  -78.2344
          (6)	23.5499  -77.9796
          (7)	23.6005  -77.7264
          (8)	23.6589  -77.475
          [SNIP]
          (86)	36.9199  -78.4856
          (87)	36.9469  -78.7809
          (88)	36.9649  -79.0773
          (89)	36.9739  -79.3744
          (90)	36.9739  -79.6717
          (91)	36.9649  -79.9688
          (92)	36.9469  -80.2651
          (93)	36.9199  -80.5604
          (94)	36.8839  -80.854
          [SNIP]
          (172)	23.6005  -81.3196
          (173)	23.5499  -81.0665
          (174)	23.5069  -80.8117
          (175)	23.4717  -80.5555
          (176)	23.4443  -80.2983
          (177)	23.4247  -80.0403
          (178)	23.4129  -79.7818
          (179)	23.409   -79.523
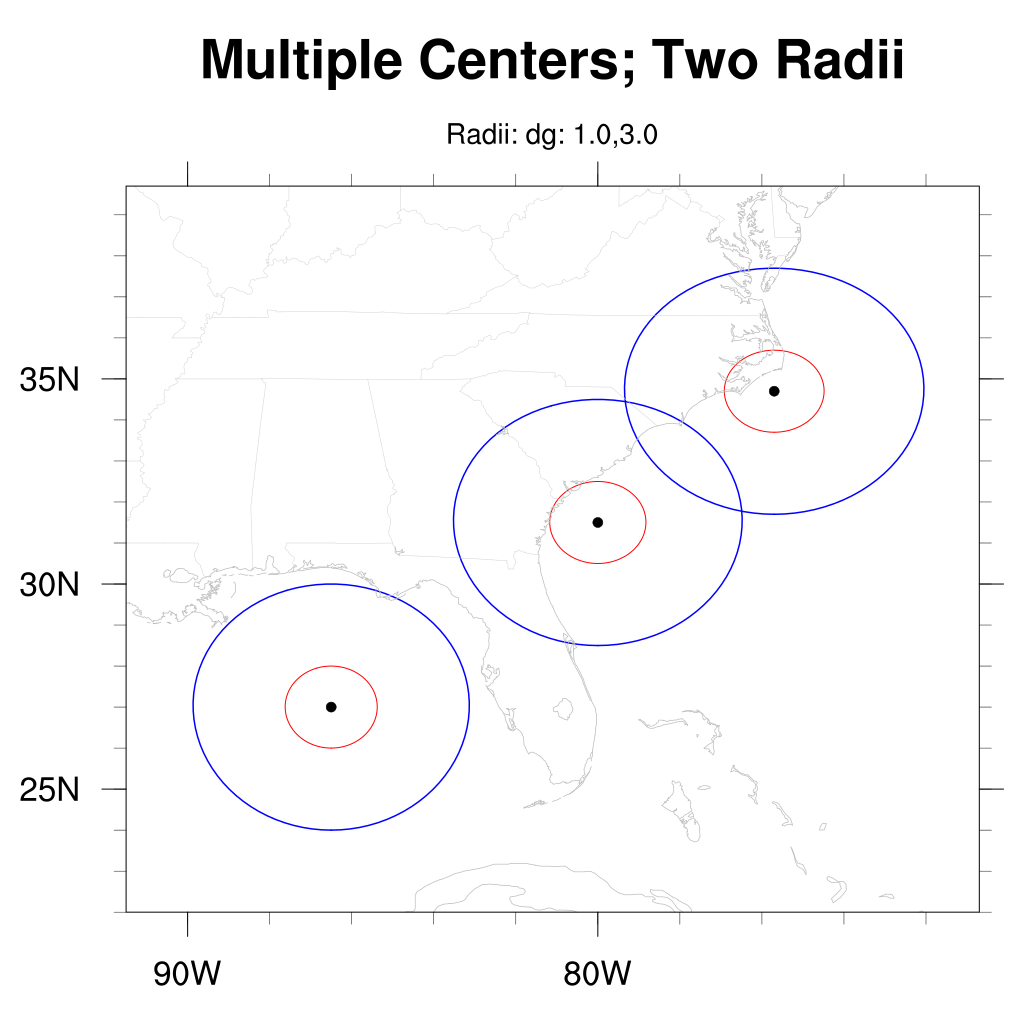
Example 2: The following illustrates multiple locations and radii. The full script is here. The created plot is here.
;---Multiple locations (eg: time series of locations) and radii

  slat      = (/ 27.0, 31.5, 34.7 /)       ; lat: stations or storm centers
  slon      = (/273.5,280.0,284.3/)        ; lon: stations or storm centers
  srad      = (/ 1, 3 /)                   ; radii (great circle degrees)
  srad_unit = 0                            ; 0=degrees
  N         = 90                           ; # of points; more points nicer 'circle'
  opt       = False
[SNIP]
The (edited) output follows:
          Variable: circle_lat
          Type: float
          Total Size: 2160 bytes
                      540 values
          Number of Dimensions: 3
          Dimensions and sizes:	[location | 3] x [radii | 2] x [circle | 90]
          Coordinates:
          Number Of Attributes: 5
            _FillValue :	9.96921e+36
            radii_units_input :	great_circle_degrees
            radii_input_values :	(  1,  3 )
            long_name :	circle latitudes
            units :	degrees_north

         ------------------

          Variable: circle_lon
          Type: float
          Total Size: 2160 bytes
                      540 values
          Number of Dimensions: 3
          Dimensions and sizes:	[location | 3] x [radii | 2] x [circle | 90]
          Coordinates:
          Number Of Attributes: 5
            _FillValue :	9.96921e+36
            radii_input_values :	(  1,  3 )
            radii_units_input :	great_circle_degrees
            long_name :	circle longitudes
            units :	degrees_east
Example 3: Mask values using gc_inout. Plot data within defined radius only.
See: Examples polyg_29, polyg_30, polyg_31