- Set pmLegendDisplayMode = "Always". (Examples 1, 2, 3, or 4.)
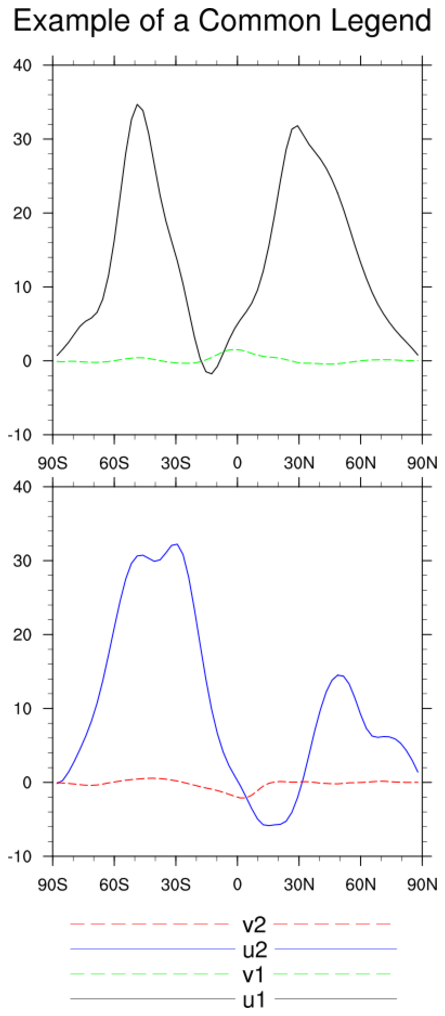
- Create a common legend for use in paneled plots. (Example 5.)
- Use gsn_legend_ndc. (Example 6.)
- Make individual calls to gsn_polymarker_ndc and gsn_text_ndc. (Example 7.)
- Use gsn_create_legend. (Example 8.)
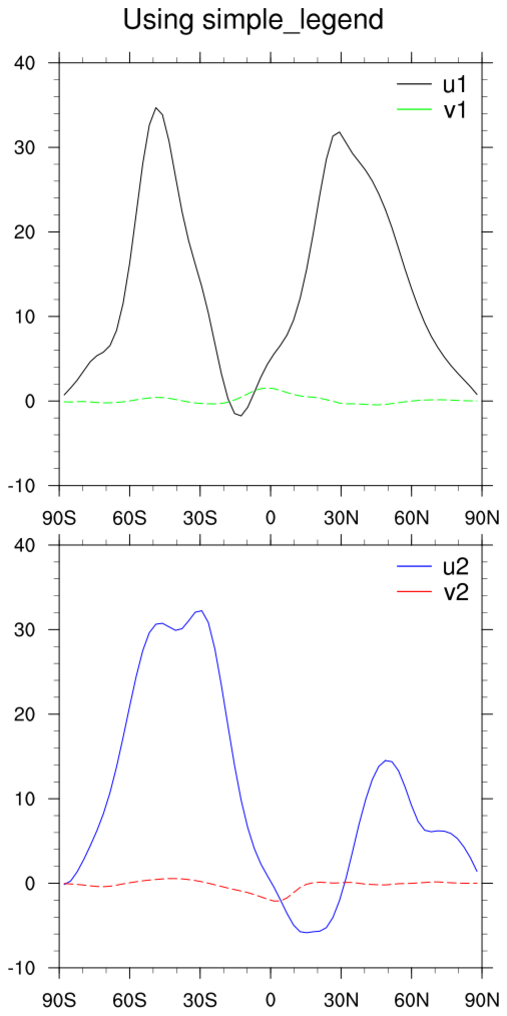
- Use simple_legend. (Examples 16, 17 and 19.)
- Use simple_legend_ndc. (Examples 20 and 21.)
NCL Home>
Application examples>
Plot techniques
 leg_1.ncl: The resources in this
script contain the bare minimum to get a two item legend in the upper
left corner of the plot. The default values of many of these resources
draw a huge legend that is outside of the plot domain.
leg_1.ncl: The resources in this
script contain the bare minimum to get a two item legend in the upper
left corner of the plot. The default values of many of these resources
draw a huge legend that is outside of the plot domain.
 leg_2.ncl: Adds a title and bounding box
to the plot. Changes the position of the legend.
leg_2.ncl: Adds a title and bounding box
to the plot. Changes the position of the legend.
 leg_3.ncl: Demonstrates what
a legend looks like with colored markers. Swaps the orientation.
leg_3.ncl: Demonstrates what
a legend looks like with colored markers. Swaps the orientation.
 leg_4.ncl: In many cases there may be
very little space on a line plot to place a label, particularly when
there are many lines and the label is long. This examples demonstrates
making the legend horizontal, using the height and width attributes to
really shrink the lines, and then angling the labels in order to
shrink it even more.
leg_4.ncl: In many cases there may be
very little space on a line plot to place a label, particularly when
there are many lines and the label is long. This examples demonstrates
making the legend horizontal, using the height and width attributes to
really shrink the lines, and then angling the labels in order to
shrink it even more.
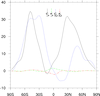
 leg_5.ncl: Demonstrates the old
way of creating a custom legend. See example 6 for an easier
method.
leg_5.ncl: Demonstrates the old
way of creating a custom legend. See example 6 for an easier
method.
 leg_sln_5.ncl: This example is similar to leg_5.ncl, except the legend is created using
simple_legend_ndc. The first frame shows how you can use the
drawNDCGrid procedure to help determine the values for the position
of the legend. The second image is the exact same image, except without the NDC grid.
leg_sln_5.ncl: This example is similar to leg_5.ncl, except the legend is created using
simple_legend_ndc. The first frame shows how you can use the
drawNDCGrid procedure to help determine the values for the position
of the legend. The second image is the exact same image, except without the NDC grid.
 leg_sl_5.ncl: This example is similar to leg_5.ncl, except the legend
is split in two and attached to the appropriate plots using simple_legend.
leg_sl_5.ncl: This example is similar to leg_5.ncl, except the legend
is split in two and attached to the appropriate plots using simple_legend.
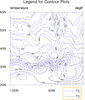
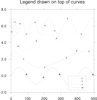
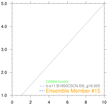
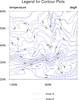 leg_6.ncl: Demonstrates the addition
of a legend for a contour-on-contour plot.
leg_6.ncl: Demonstrates the addition
of a legend for a contour-on-contour plot.
 leg_8.ncl: Demonstrates how to create a
legend by using gsn_create_legend, available
in NCL version 4.2.0.a034. After the legend is created you have to attach
it to the plot by using gsn_add_annotation.
leg_8.ncl: Demonstrates how to create a
legend by using gsn_create_legend, available
in NCL version 4.2.0.a034. After the legend is created you have to attach
it to the plot by using gsn_add_annotation.
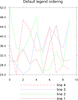
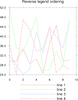 leg_9.ncl: Demonstrates how to change
the order of the items in a legend using the lgItemOrder resource, added in version 5.1.0.
leg_9.ncl: Demonstrates how to change
the order of the items in a legend using the lgItemOrder resource, added in version 5.1.0.
 leg_10.ncl: This example demonstrates
how to fill the legend box so that it masks the XY curves,
by setting lgPerimFill to
"SolidFill" and lgPerimFillColor
to the desired fill color.
leg_10.ncl: This example demonstrates
how to fill the legend box so that it masks the XY curves,
by setting lgPerimFill to
"SolidFill" and lgPerimFillColor
to the desired fill color.
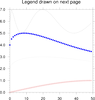
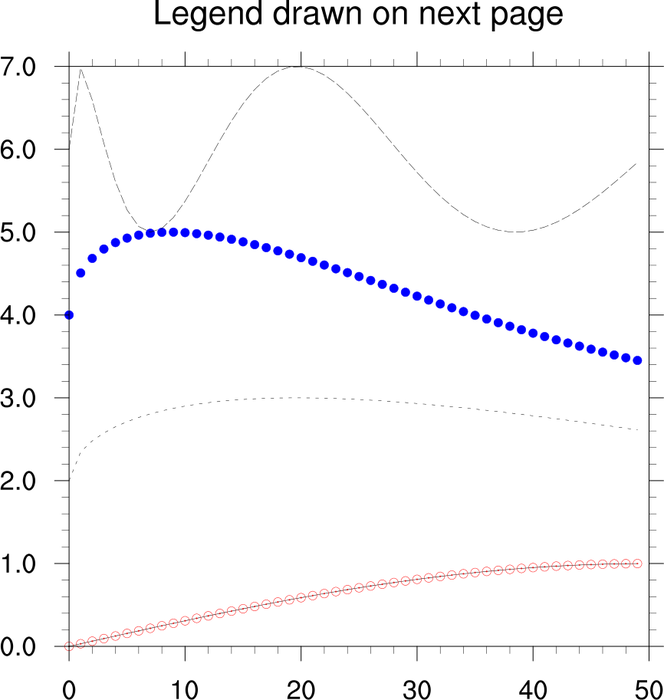
 leg_11.ncl: This example demonstrates
how to create a separate legend based on XY resource settings
and draw it on a separate page.
leg_11.ncl: This example demonstrates
how to create a separate legend based on XY resource settings
and draw it on a separate page.
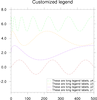 leg_12.ncl: This example demonstrates
how to customize a legend by:
leg_12.ncl: This example demonstrates
how to customize a legend by:

 leg_sln_12.ncl: This example is like leg_12, but also demonstrates
how to create legends by using simple_legend_ndc for legends outside
the plot, and simple_legend for legends inside the plot.
leg_sln_12.ncl: This example is like leg_12, but also demonstrates
how to create legends by using simple_legend_ndc for legends outside
the plot, and simple_legend for legends inside the plot.
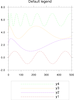
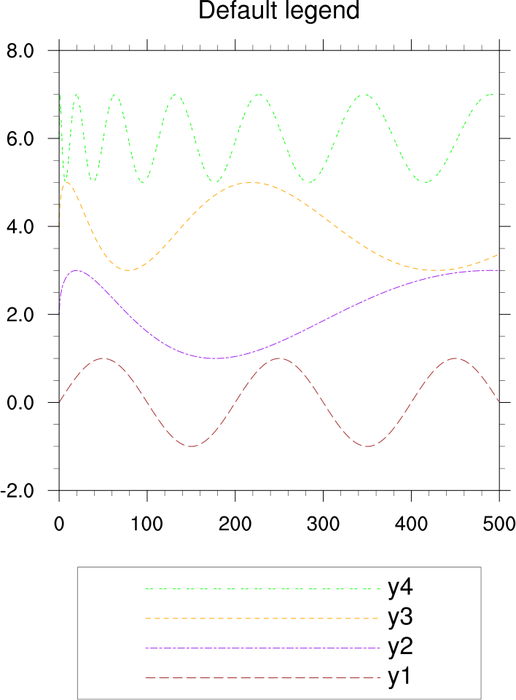
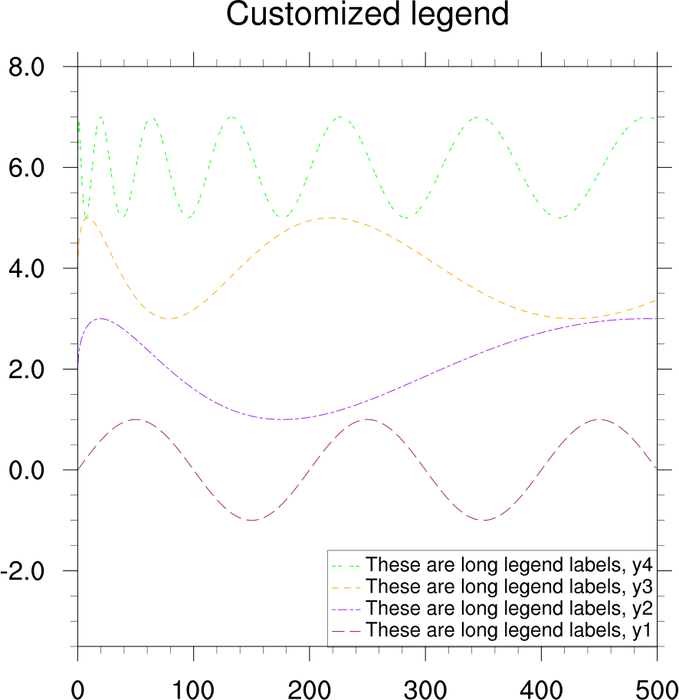
 leg_13.ncl: This example demonstrates
how to customize a legend based on resource settings in an XY plot.
This method may be desired if you need to turn off individual legend
items, which you can't do very easily using the legend that comes with
the XY plot.
leg_13.ncl: This example demonstrates
how to customize a legend based on resource settings in an XY plot.
This method may be desired if you need to turn off individual legend
items, which you can't do very easily using the legend that comes with
the XY plot.
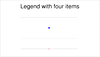
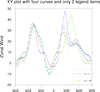
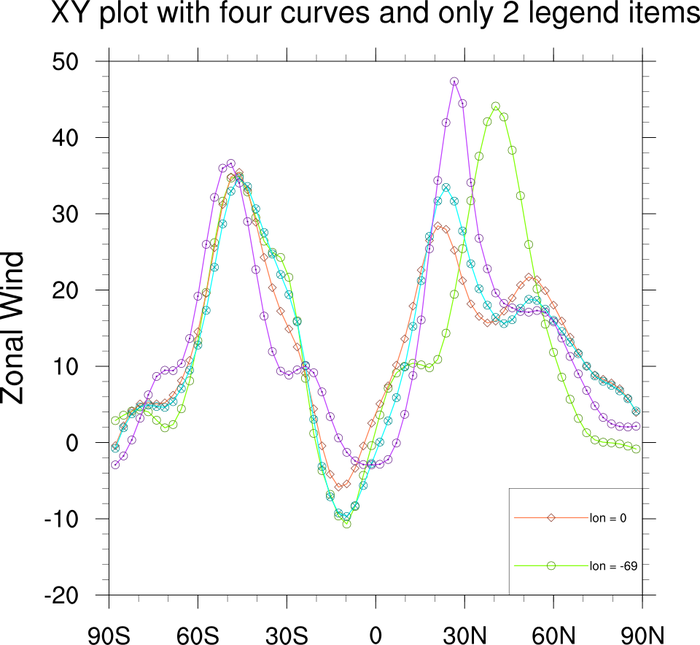
 leg_14.ncl: This example demonstrates
how to create an XY plot with four curves, but only include a legend
for two of the curves.
leg_14.ncl: This example demonstrates
how to create an XY plot with four curves, but only include a legend
for two of the curves.
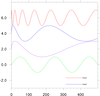
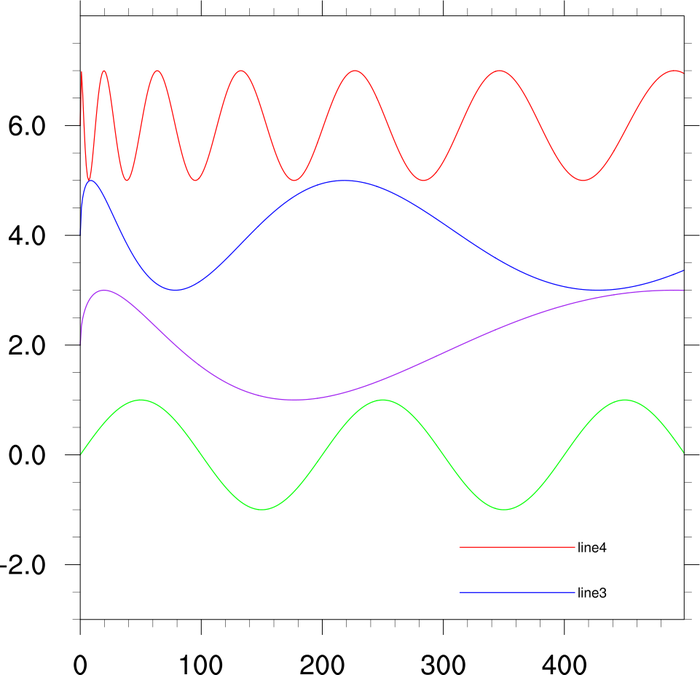
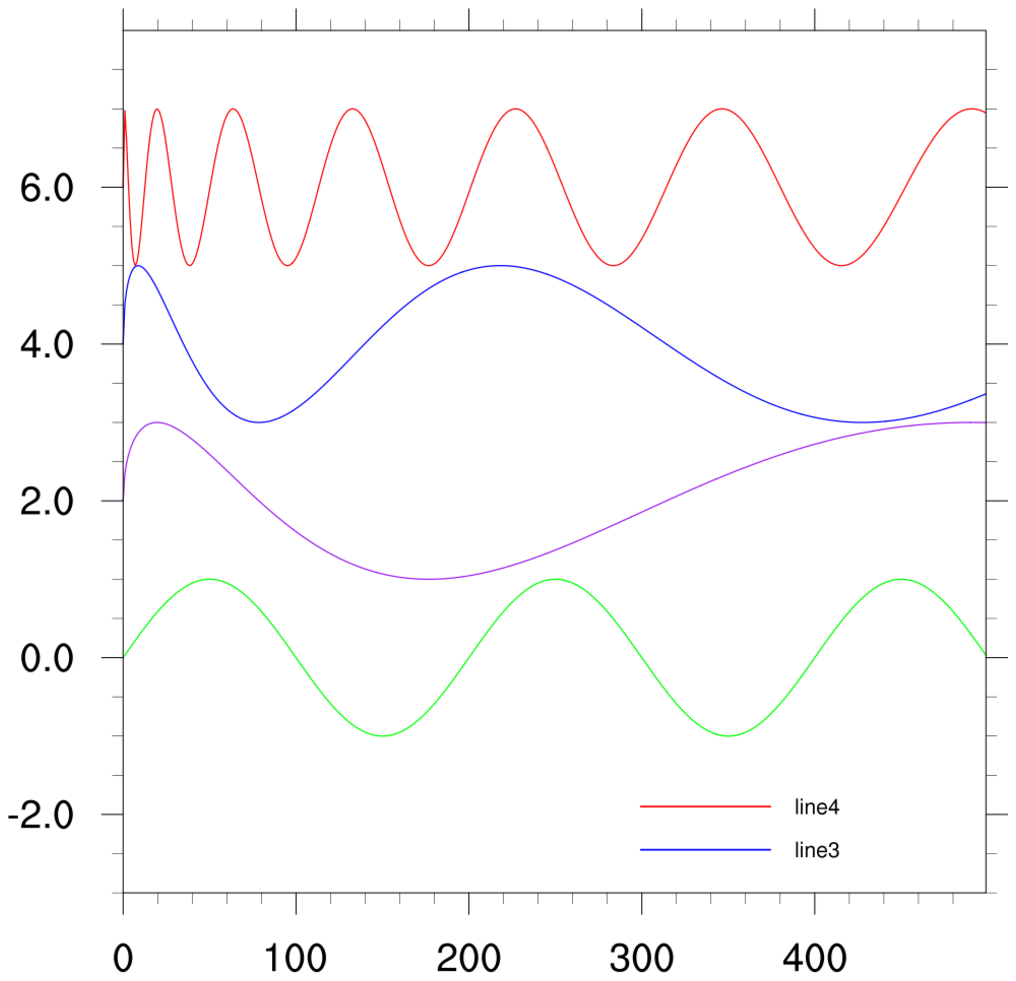
 leg_sl_14.ncl: This example is like leg_14, but demonstrates
how to use simple_legend
to draw partial legends inside plots without having to overlay.
leg_sl_14.ncl: This example is like leg_14, but demonstrates
how to use simple_legend
to draw partial legends inside plots without having to overlay.
 leg_15.ncl: This example is similar
to leg_10.ncl,except it shows how to attach one plot to another, so
you can panel them later.
gsn_add_annotation is used to
attach the plots.
leg_15.ncl: This example is similar
to leg_10.ncl,except it shows how to attach one plot to another, so
you can panel them later.
gsn_add_annotation is used to
attach the plots.
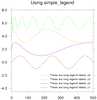
 leg_16.ncl: Demonstrates how to use
simple_legend to create a legend.
simple_legend gives the user complete
control over the design and placement of the legend by utilizing user-defined
resources.
leg_16.ncl: Demonstrates how to use
simple_legend to create a legend.
simple_legend gives the user complete
control over the design and placement of the legend by utilizing user-defined
resources.
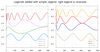
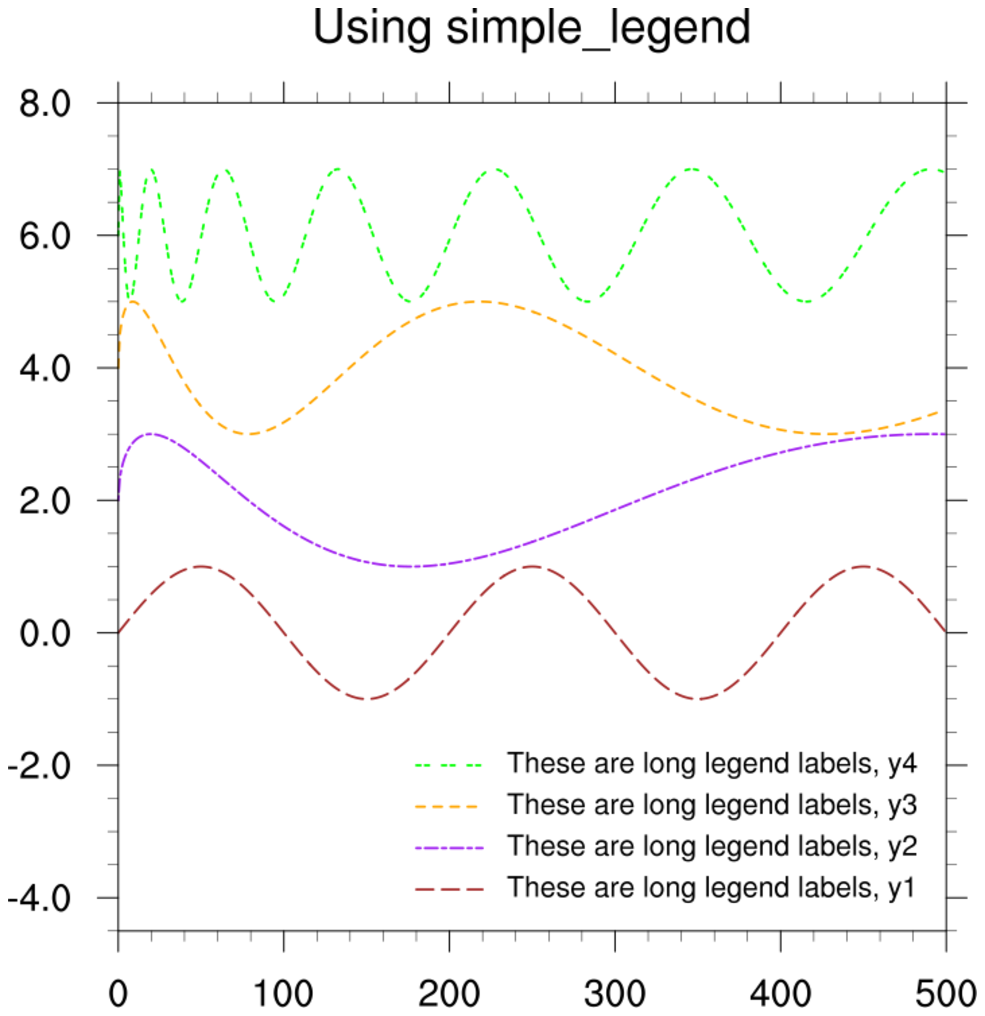
 leg_17.ncl: Similar to leg_16.ncl, this script demonstrates how to use
simple_legend to create a legend by invoking
all possible resources that simple_legend accepts.
leg_17.ncl: Similar to leg_16.ncl, this script demonstrates how to use
simple_legend to create a legend by invoking
all possible resources that simple_legend accepts.
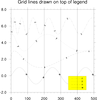
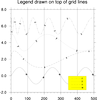
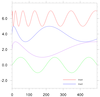
 leg_18.ncl: This example is similar
to leg_15.ncl, except it turns on on the X and Y axis grid lines and
uses the tmGridDrawOrder resource to
force the grid lines to be drawn before the legend.
leg_18.ncl: This example is similar
to leg_15.ncl, except it turns on on the X and Y axis grid lines and
uses the tmGridDrawOrder resource to
force the grid lines to be drawn before the legend.
 leg_19.ncl: This example is similar
to leg_18.ncl, except the legends are added using
simple_legend.
leg_19.ncl: This example is similar
to leg_18.ncl, except the legends are added using
simple_legend.
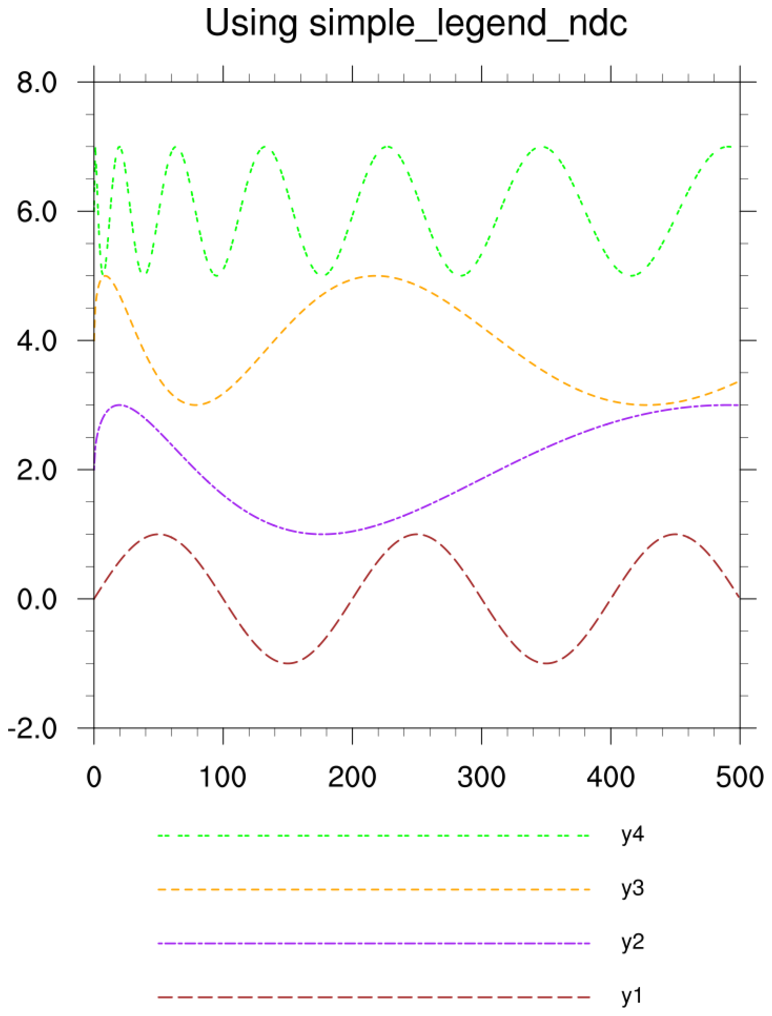
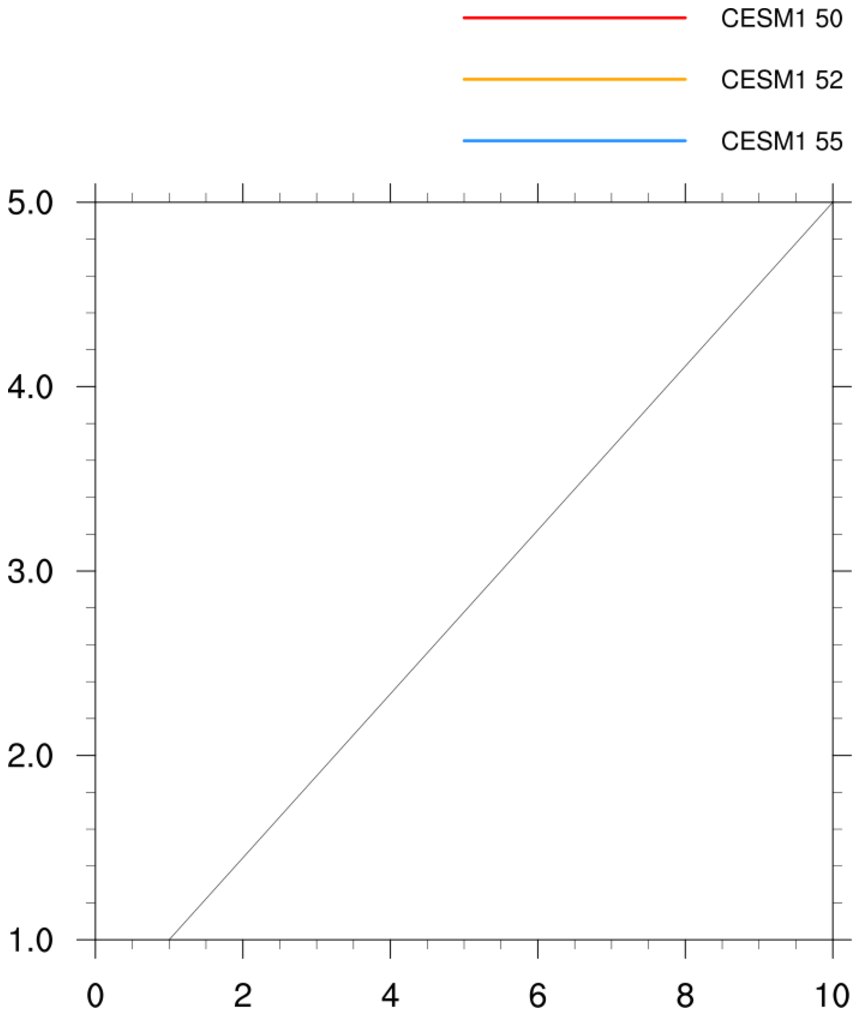
 leg_20.ncl: Demonstrates how to use
simple_legend_ndc to create a legend.
simple_legend_ndc gives the user complete
control over the design and placement of the legend by utilizing user-defined
resources, similar to simple_legend, but
in NDC space.
leg_20.ncl: Demonstrates how to use
simple_legend_ndc to create a legend.
simple_legend_ndc gives the user complete
control over the design and placement of the legend by utilizing user-defined
resources, similar to simple_legend, but
in NDC space.
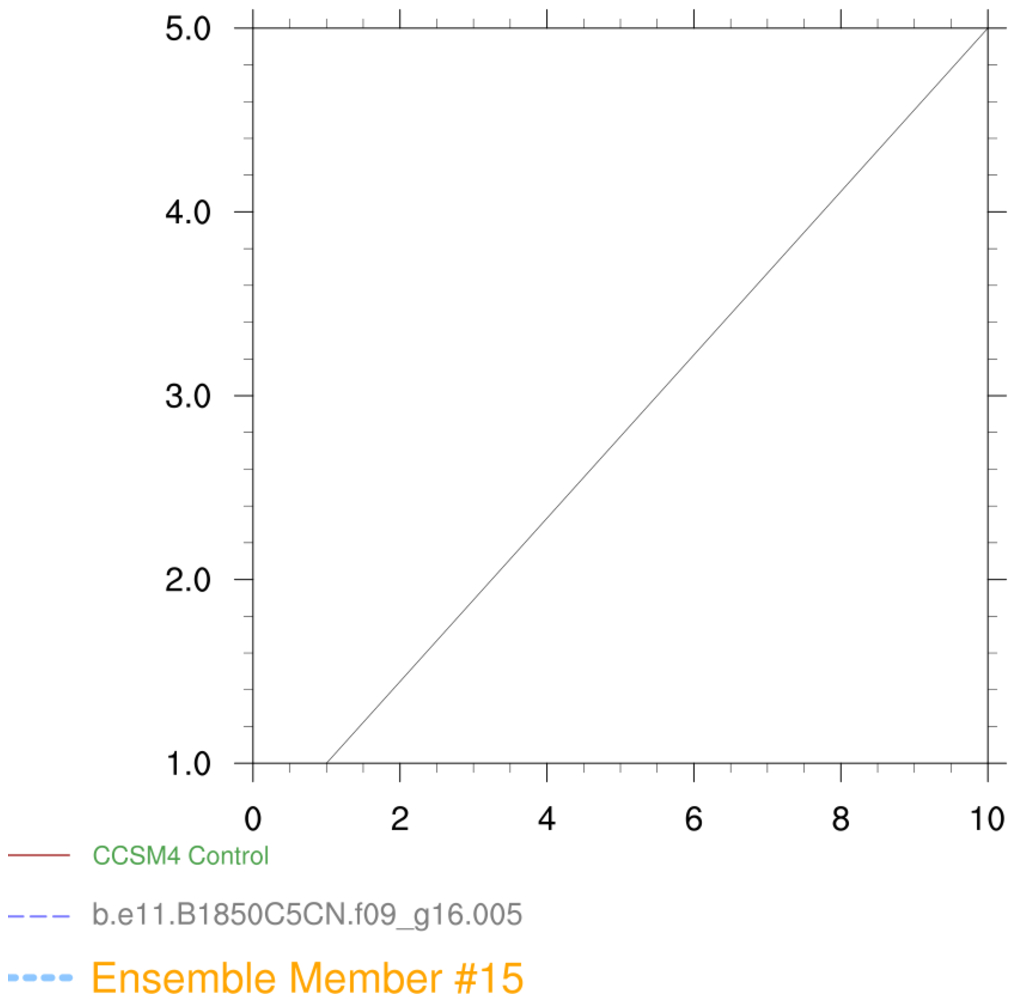
 leg_21.ncl: This example is similar to leg_20, but shows how to
customize the legend lines and labels, and position the legend differently.
leg_21.ncl: This example is similar to leg_20, but shows how to
customize the legend lines and labels, and position the legend differently.
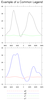
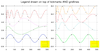
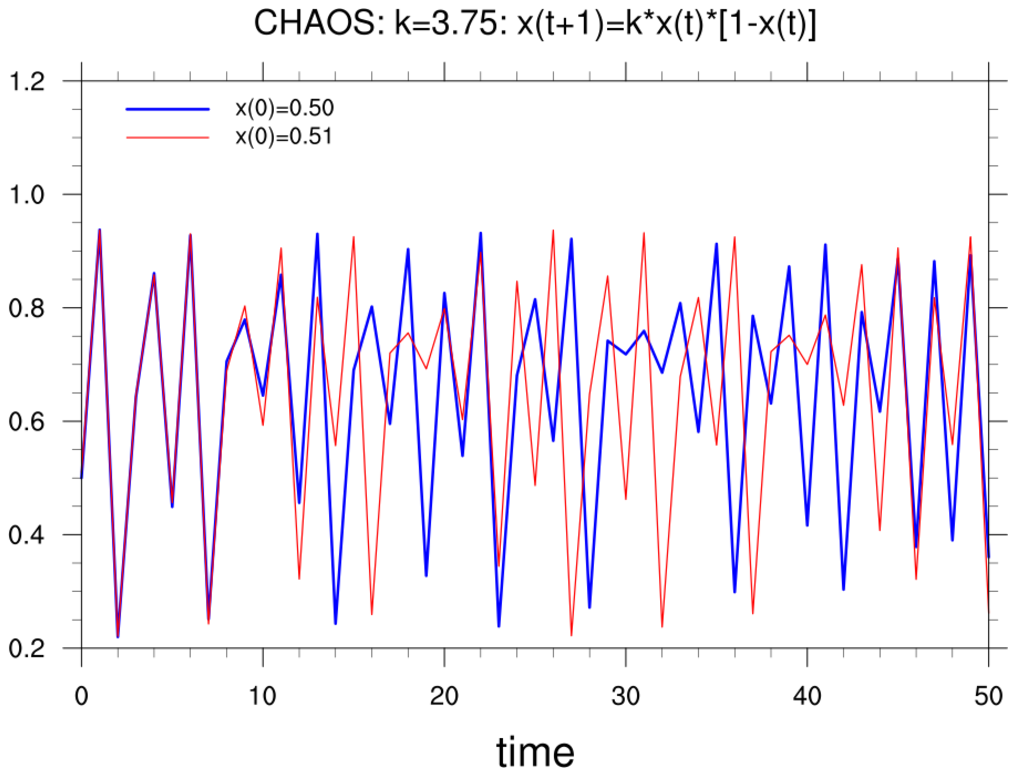
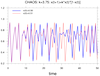 leg_22.ncl:
A simple illustration of 'chaos' showing the sensitivity to an initial condition.
This uses simple_legend to create a legend.
leg_22.ncl:
A simple illustration of 'chaos' showing the sensitivity to an initial condition.
This uses simple_legend to create a legend.
NCL Graphics: Legends
There are seven distinct ways to create legends, and all are shown in the examples below.
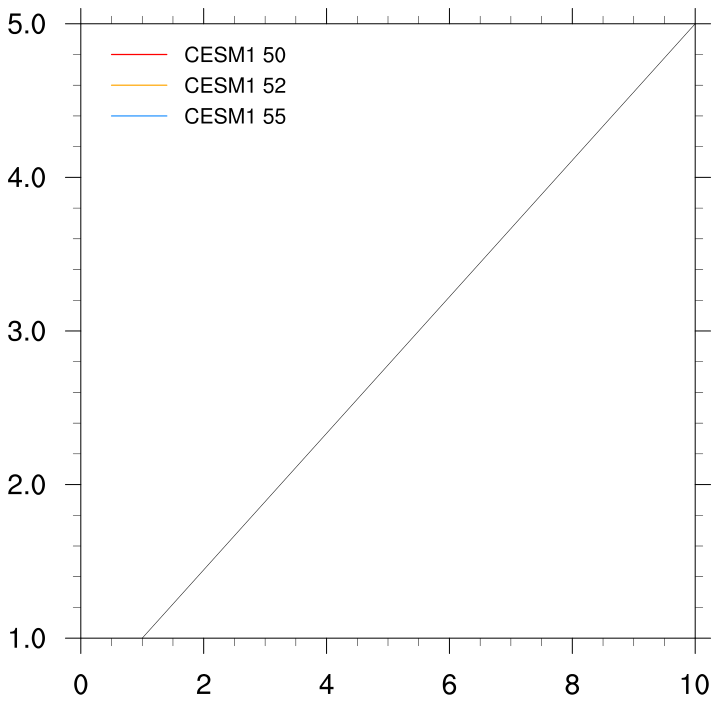
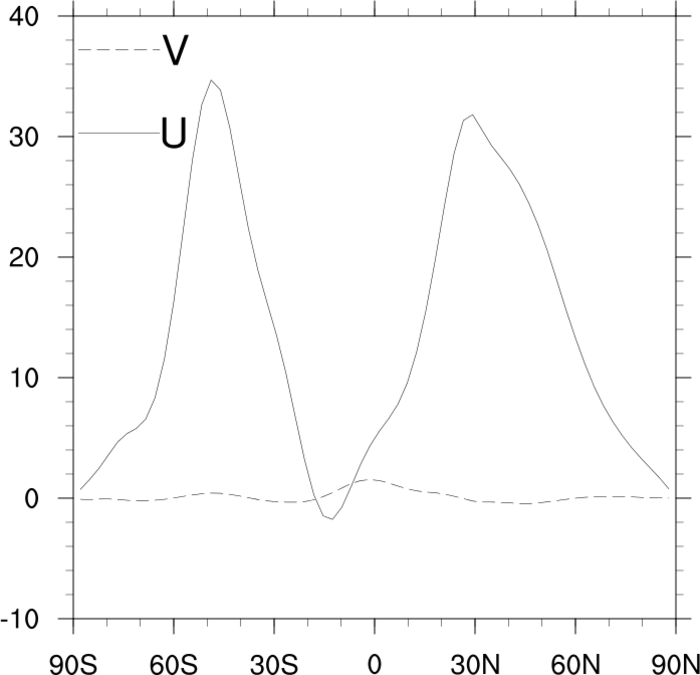 leg_1.ncl: The resources in this
script contain the bare minimum to get a two item legend in the upper
left corner of the plot. The default values of many of these resources
draw a huge legend that is outside of the plot domain.
leg_1.ncl: The resources in this
script contain the bare minimum to get a two item legend in the upper
left corner of the plot. The default values of many of these resources
draw a huge legend that is outside of the plot domain.
pmLegendDisplayMode = "Always"
Turns on the legend. The location of the legend within the plot is
controlled primarily by three resources. One chooses the reference
axis (pmLegendSide = "Top") and
the other two determine in NDC coordinates how far to move the legend
perpendicular (pmLegendOrthogonalPosF = -0.3 ) and
parallel (pmLegendParallelPosF =
.1) to this reference axis.
In this example the top axis is the
reference, and the Parallel value of .1 keeps the legend close to the
left axis. Increasing this value will move the legend at the same
"height" across the plot to the right.
Note that the orthogonal position is negative. This is expected. In this case decreasing values (e.g. from -0.3 to -0.4) would move the legend down the plot.
The default size of the legend is much to large for the plot, so
several resources are set to resize the legend:
pmLegendWidthF = 0.15
pmLegendHeightF = 0.18.
The default size of the legend labels is also too large, and so is scaled down with lgLabelFontHeightF = 0.03.
The values of the legend labels are determined by:
xyExplicitLegendLabels = (/"U","V"/). The default
value is the name of the variable.
Finally, the default box around the legend is turned off with:
lgPerimOn = False
A Python version of this projection is available here.
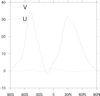
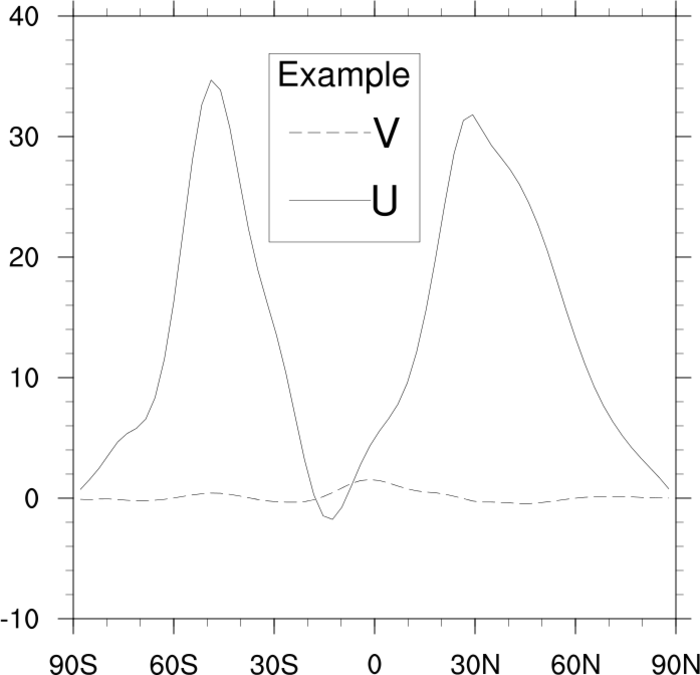 leg_2.ncl: Adds a title and bounding box
to the plot. Changes the position of the legend.
leg_2.ncl: Adds a title and bounding box
to the plot. Changes the position of the legend.
lgTitleOn = True
lgTitleString = "Example"
lgTitleFontHeightF = .025, Turns on the title and
sets its value and font size.
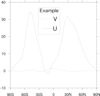
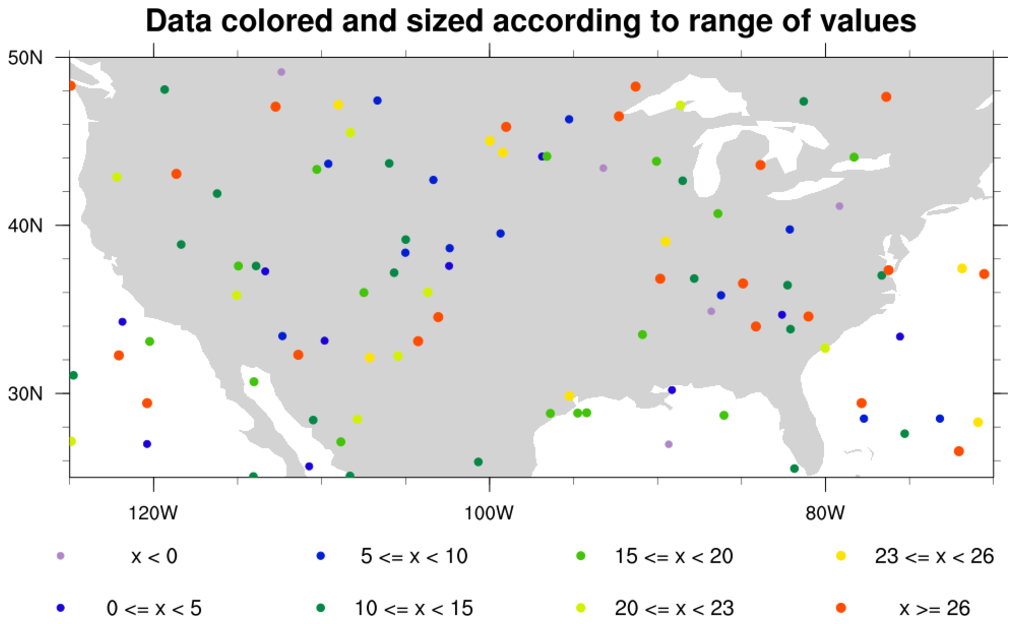
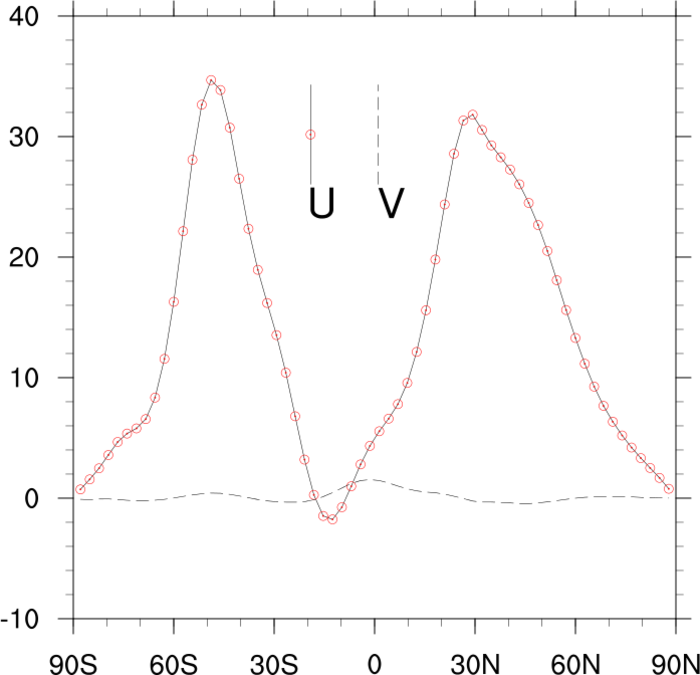 leg_3.ncl: Demonstrates what
a legend looks like with colored markers. Swaps the orientation.
leg_3.ncl: Demonstrates what
a legend looks like with colored markers. Swaps the orientation.
lgOrientation = "horizontal"
changes the orientation of the legend.
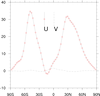
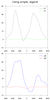
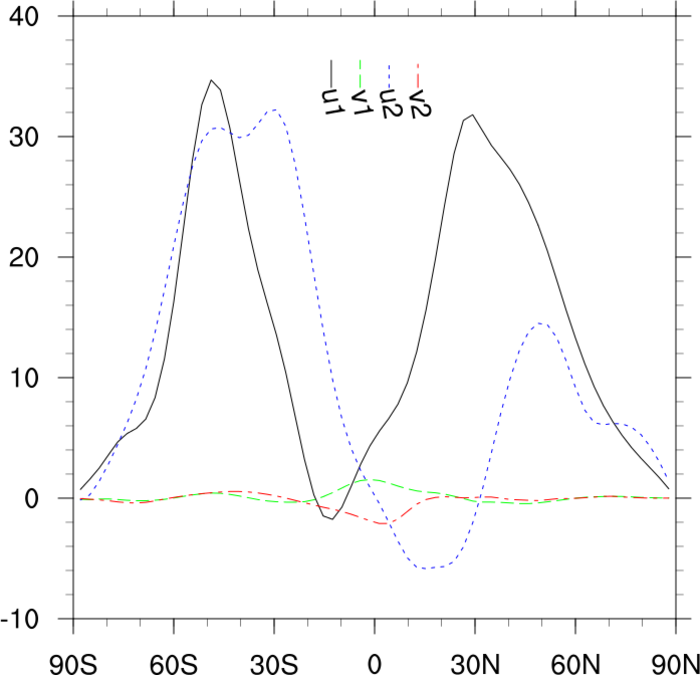 leg_4.ncl: In many cases there may be
very little space on a line plot to place a label, particularly when
there are many lines and the label is long. This examples demonstrates
making the legend horizontal, using the height and width attributes to
really shrink the lines, and then angling the labels in order to
shrink it even more.
leg_4.ncl: In many cases there may be
very little space on a line plot to place a label, particularly when
there are many lines and the label is long. This examples demonstrates
making the legend horizontal, using the height and width attributes to
really shrink the lines, and then angling the labels in order to
shrink it even more.
lgLabelAngleF = 280., Changes the angle of the labels.
pmLegendWidthF = 0.12
pmLegendHeightF = 0.05
lgLabelFontHeightF = .02
were the values
I chose to make this legend small. You can experiment with values that
work for you.
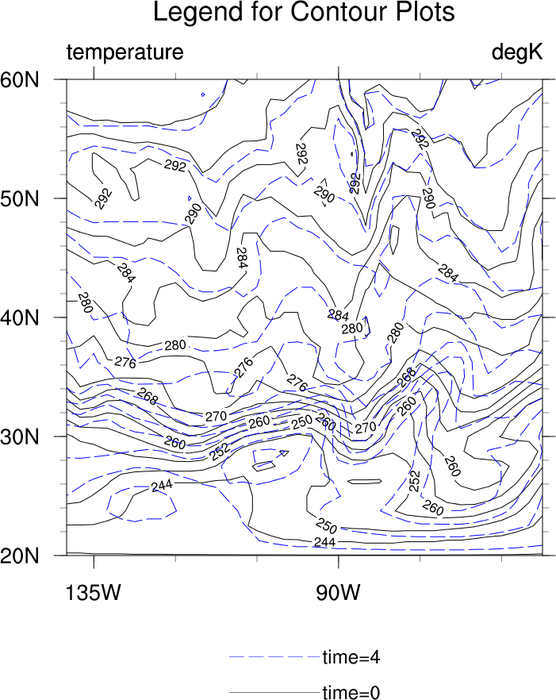
 leg_5.ncl: Demonstrates the old
way of creating a custom legend. See example 6 for an easier
method.
leg_5.ncl: Demonstrates the old
way of creating a custom legend. See example 6 for an easier
method.
A legend can have two types of labels. One is in the center of the line lgLineLabelStrings, and the other is at the end lgLabelStrings. This example uses the former, which is why several of the resources are different from the other legend examples.
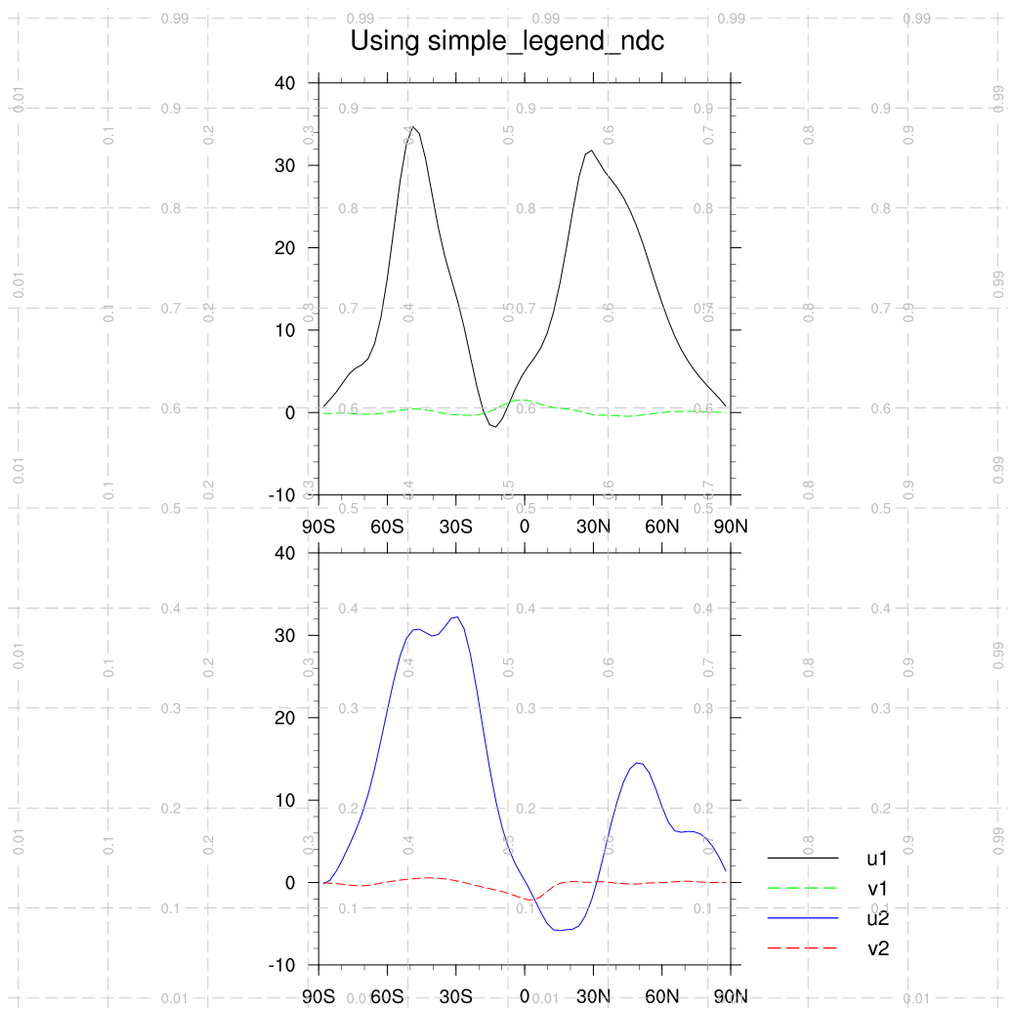
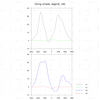
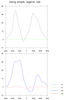
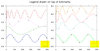
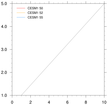
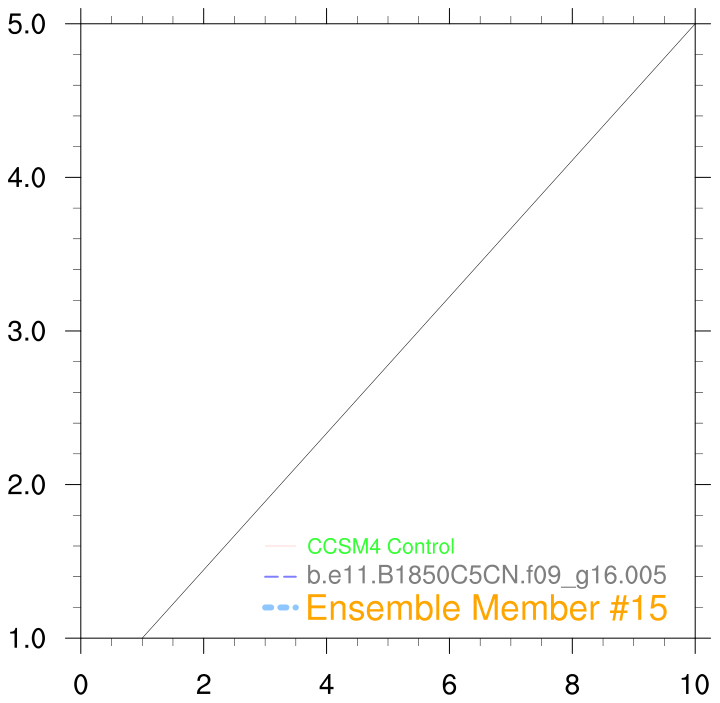
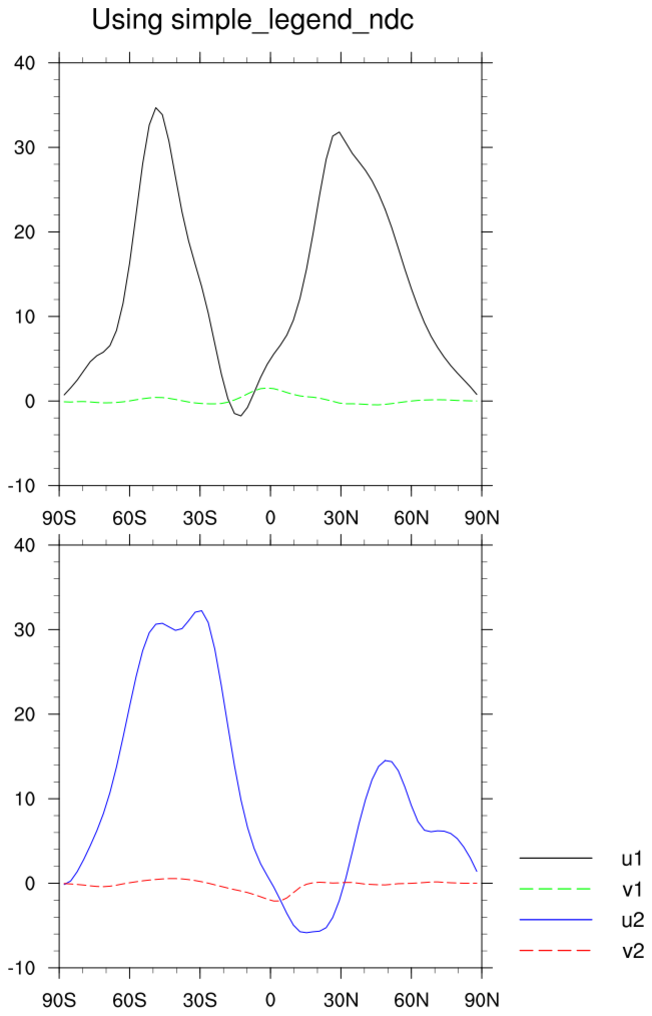 leg_sln_5.ncl: This example is similar to leg_5.ncl, except the legend is created using
simple_legend_ndc. The first frame shows how you can use the
drawNDCGrid procedure to help determine the values for the position
of the legend. The second image is the exact same image, except without the NDC grid.
leg_sln_5.ncl: This example is similar to leg_5.ncl, except the legend is created using
simple_legend_ndc. The first frame shows how you can use the
drawNDCGrid procedure to help determine the values for the position
of the legend. The second image is the exact same image, except without the NDC grid.
This example requires NCL V6.5.0 to run.
 leg_sl_5.ncl: This example is similar to leg_5.ncl, except the legend
is split in two and attached to the appropriate plots using simple_legend.
leg_sl_5.ncl: This example is similar to leg_5.ncl, except the legend
is split in two and attached to the appropriate plots using simple_legend.
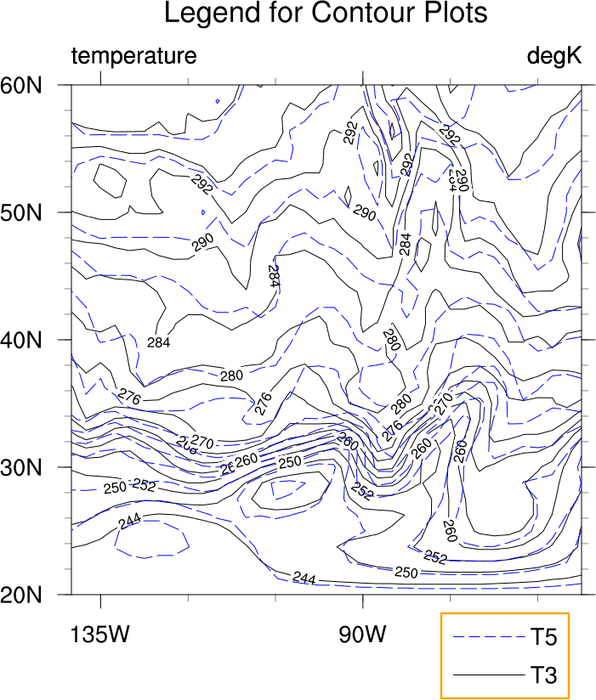
 leg_6.ncl: Demonstrates the addition
of a legend for a contour-on-contour plot.
leg_6.ncl: Demonstrates the addition
of a legend for a contour-on-contour plot.
gsn_legend_ndc is the function that will add a legend to a contour plot.
 leg_8.ncl: Demonstrates how to create a
legend by using gsn_create_legend, available
in NCL version 4.2.0.a034. After the legend is created you have to attach
it to the plot by using gsn_add_annotation.
leg_8.ncl: Demonstrates how to create a
legend by using gsn_create_legend, available
in NCL version 4.2.0.a034. After the legend is created you have to attach
it to the plot by using gsn_add_annotation.
Note when using gsn_add_annotation that gsnDraw and gsnFrame must be set to False. This results in the need to call draw and frame after the legend is attached to the plot
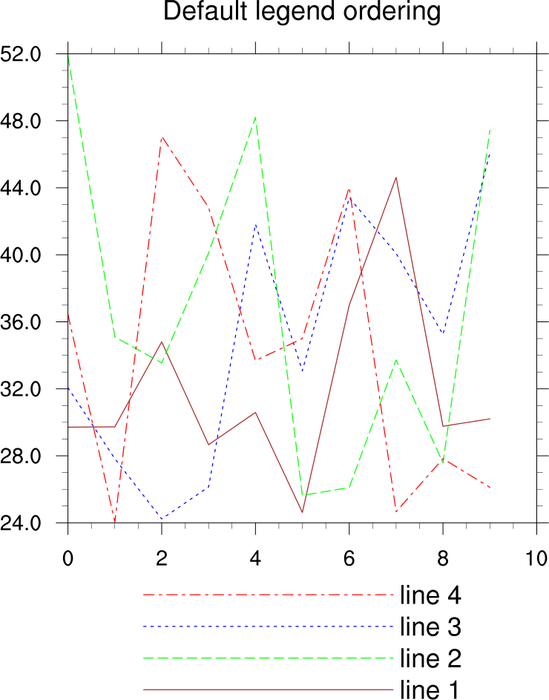
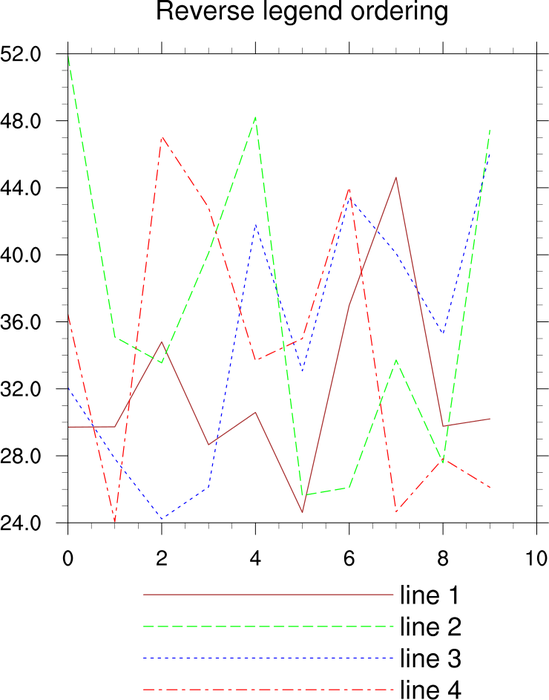 leg_9.ncl: Demonstrates how to change
the order of the items in a legend using the lgItemOrder resource, added in version 5.1.0.
leg_9.ncl: Demonstrates how to change
the order of the items in a legend using the lgItemOrder resource, added in version 5.1.0.
 leg_10.ncl: This example demonstrates
how to fill the legend box so that it masks the XY curves,
by setting lgPerimFill to
"SolidFill" and lgPerimFillColor
to the desired fill color.
leg_10.ncl: This example demonstrates
how to fill the legend box so that it masks the XY curves,
by setting lgPerimFill to
"SolidFill" and lgPerimFillColor
to the desired fill color.
If you add other plot items, like grid lines (see 2nd and 3rd images), then you need to draw the plot twice in order to get the legend to mask the additional items.
NOTE: in NCL V6.5.0, a new tmGridDrawOrder resource was added that allows you to control which phase the grid lines are drawn in ("PreDraw", "Draw", "PostDraw"). See the leg_650_10.ncl script.
Setting xyLabelMode = "Custom" allows you specify labels for the XY curves. These labels will automatically be used in the legend.
 leg_11.ncl: This example demonstrates
how to create a separate legend based on XY resource settings
and draw it on a separate page.
leg_11.ncl: This example demonstrates
how to create a separate legend based on XY resource settings
and draw it on a separate page.
The following XY resources translate into the following legend resources:
| xyMarkLineModes | lgItemTypes |
| xyDashPatterns | lgDashIndexes |
| xyMarkers | lgMarkerIndexes |
| xyMarkerColors | lgMarkerColors |
Note that you have to set lgAutoManage to False in order to be able to control the font height of the legend title (lgTitleFontHeightF).
 leg_12.ncl: This example demonstrates
how to customize a legend by:
leg_12.ncl: This example demonstrates
how to customize a legend by:
moving it into the plot (pmLegendOrthogonalPosF / pmLegendParallelPosF)
changing the legend width and height
(pmLegendWidthF
/ pmLegendHeightF)
increasing the label size
(lgLabelFontHeightF)
decreasing the length of the legend lines
(lgBoxMinorExtentF)
 leg_sln_12.ncl: This example is like leg_12, but also demonstrates
how to create legends by using simple_legend_ndc for legends outside
the plot, and simple_legend for legends inside the plot.
leg_sln_12.ncl: This example is like leg_12, but also demonstrates
how to create legends by using simple_legend_ndc for legends outside
the plot, and simple_legend for legends inside the plot.In addition, this example also shows how to customize the legend labels and line length.
 leg_13.ncl: This example demonstrates
how to customize a legend based on resource settings in an XY plot.
This method may be desired if you need to turn off individual legend
items, which you can't do very easily using the legend that comes with
the XY plot.
leg_13.ncl: This example demonstrates
how to customize a legend based on resource settings in an XY plot.
This method may be desired if you need to turn off individual legend
items, which you can't do very easily using the legend that comes with
the XY plot.
This script has a function called "create_legend_from_plot" for creating and attaching the legend. It uses special attributes attached to the "opt" variable to indicate how many legend items are desired.
 leg_14.ncl: This example demonstrates
how to create an XY plot with four curves, but only include a legend
for two of the curves.
leg_14.ncl: This example demonstrates
how to create an XY plot with four curves, but only include a legend
for two of the curves.
The steps are 1) create the first plot with two curves and no legend, 2) create the second plot with the other two curves and with a legend, 3) call overlay to overlay the two plots, 4) draw the overlaid plots.
 leg_sl_14.ncl: This example is like leg_14, but demonstrates
how to use simple_legend
to draw partial legends inside plots without having to overlay.
leg_sl_14.ncl: This example is like leg_14, but demonstrates
how to use simple_legend
to draw partial legends inside plots without having to overlay.This script also shows how to create legend entries by selecting and reversing data for XY curves.
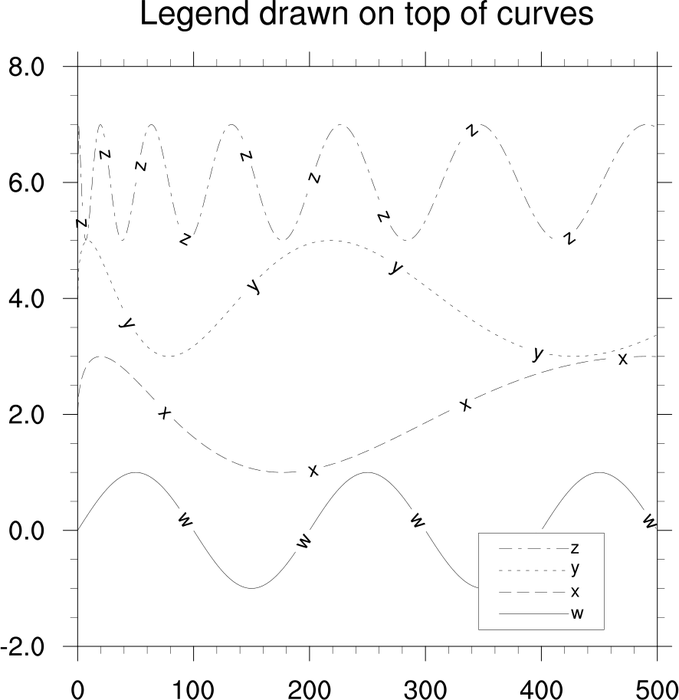
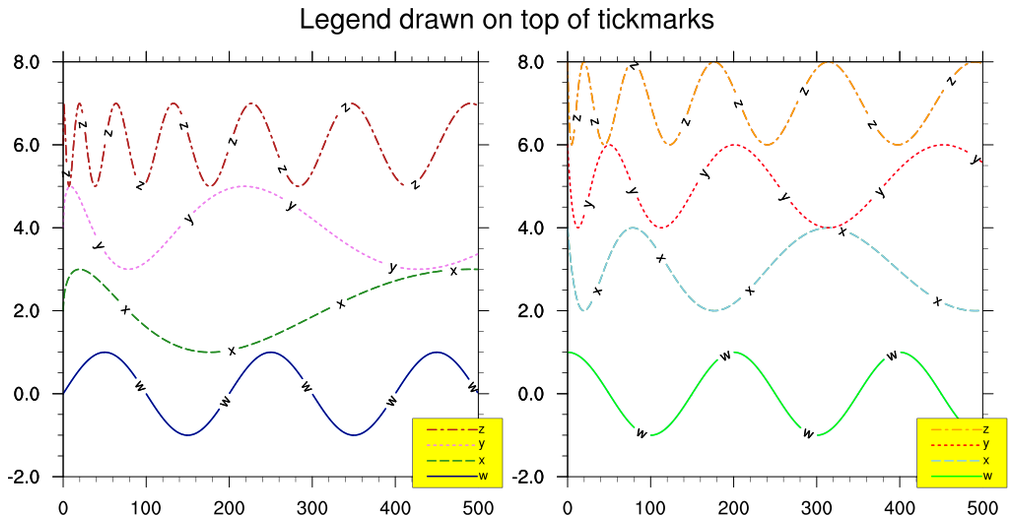 leg_15.ncl: This example is similar
to leg_10.ncl,except it shows how to attach one plot to another, so
you can panel them later.
gsn_add_annotation is used to
attach the plots.
leg_15.ncl: This example is similar
to leg_10.ncl,except it shows how to attach one plot to another, so
you can panel them later.
gsn_add_annotation is used to
attach the plots.
This example is slightly different in that it shows how to draw legends on top of tickmarks. In NCL V6.5.0, you can use the tmGridDrawOrder resource to accomplish this.
leg_16.ncl: Demonstrates how to use
simple_legend to create a legend.
simple_legend gives the user complete
control over the design and placement of the legend by utilizing user-defined
resources.
This example creates a simple XY plot and attaches the legend to the upper left corner of the plot by setting a few of the resources that the function accepts. Note that draw and frame must be called after the legend is created.
 leg_17.ncl: Similar to leg_16.ncl, this script demonstrates how to use
simple_legend to create a legend by invoking
all possible resources that simple_legend accepts.
leg_17.ncl: Similar to leg_16.ncl, this script demonstrates how to use
simple_legend to create a legend by invoking
all possible resources that simple_legend accepts.
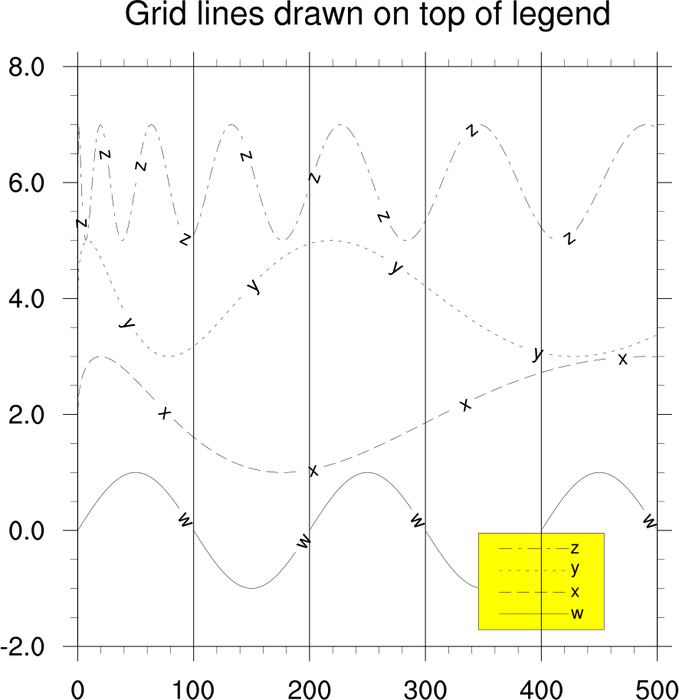
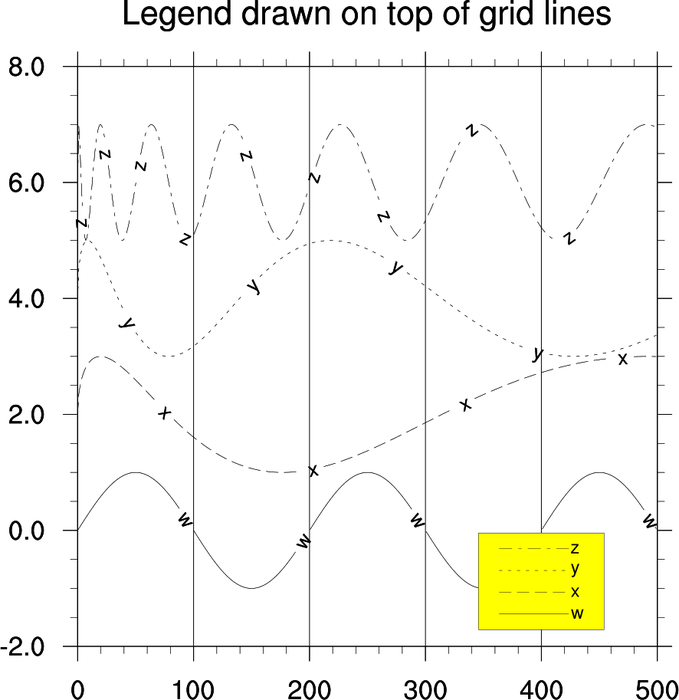
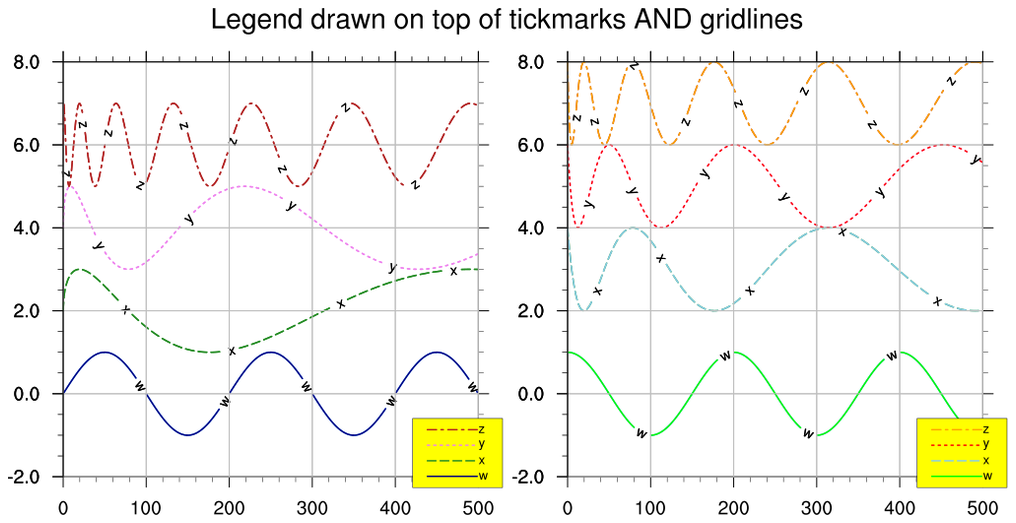 leg_18.ncl: This example is similar
to leg_15.ncl, except it turns on on the X and Y axis grid lines and
uses the tmGridDrawOrder resource to
force the grid lines to be drawn before the legend.
leg_18.ncl: This example is similar
to leg_15.ncl, except it turns on on the X and Y axis grid lines and
uses the tmGridDrawOrder resource to
force the grid lines to be drawn before the legend.This resource was added in NCL V6.5.0. If you try to run this script with NCL V6.4.0 or earlier, the grid lines will show up on top of the legend and you will get a warning:
tmGridDrawOrder is not a valid resource in leg_xy at this time
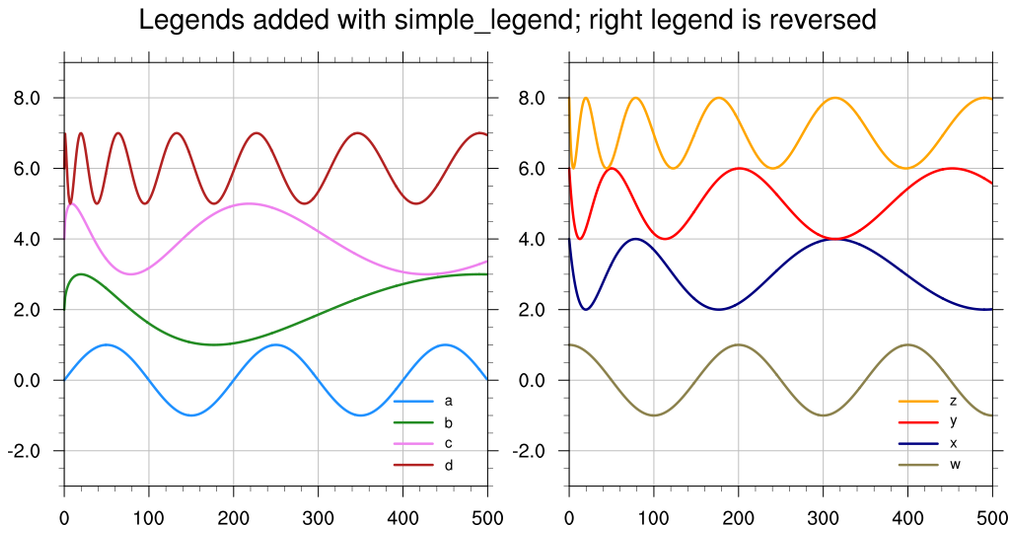 leg_19.ncl: This example is similar
to leg_18.ncl, except the legends are added using
simple_legend.
leg_19.ncl: This example is similar
to leg_18.ncl, except the legends are added using
simple_legend.
 leg_20.ncl: Demonstrates how to use
simple_legend_ndc to create a legend.
simple_legend_ndc gives the user complete
control over the design and placement of the legend by utilizing user-defined
resources, similar to simple_legend, but
in NDC space.
leg_20.ncl: Demonstrates how to use
simple_legend_ndc to create a legend.
simple_legend_ndc gives the user complete
control over the design and placement of the legend by utilizing user-defined
resources, similar to simple_legend, but
in NDC space.
 leg_21.ncl: This example is similar to leg_20, but shows how to
customize the legend lines and labels, and position the legend differently.
leg_21.ncl: This example is similar to leg_20, but shows how to
customize the legend lines and labels, and position the legend differently.
 leg_22.ncl:
A simple illustration of 'chaos' showing the sensitivity to an initial condition.
This uses simple_legend to create a legend.
leg_22.ncl:
A simple illustration of 'chaos' showing the sensitivity to an initial condition.
This uses simple_legend to create a legend.