In some cases, when you panel your plots, the contour labels will disappear even though they may show up in the original large plots. This is because when you resize a plot to fit in a panel, NCL will remove some labels that are very small contours, in order to avoid overlap. See example conLab_6.ncl below for a way to fix this.
NCL Home>
Application examples>
Plot techniques
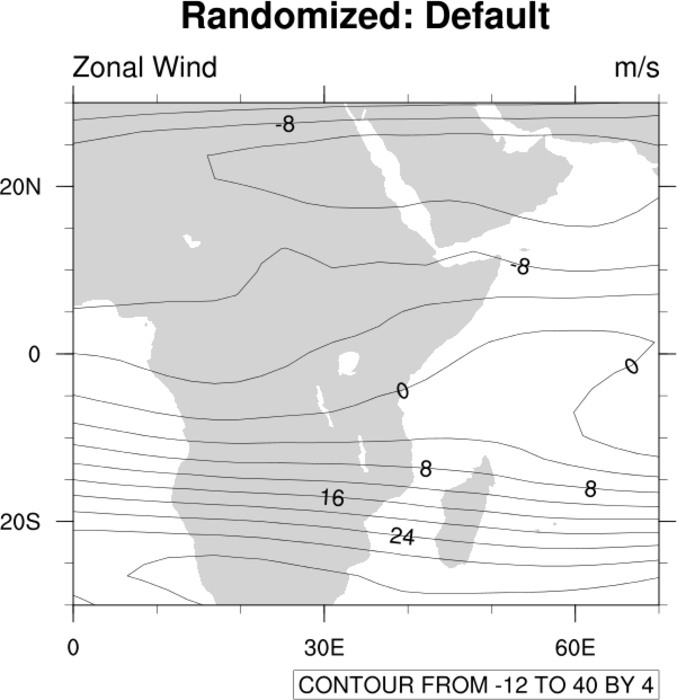
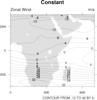
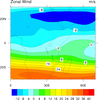
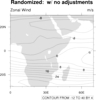
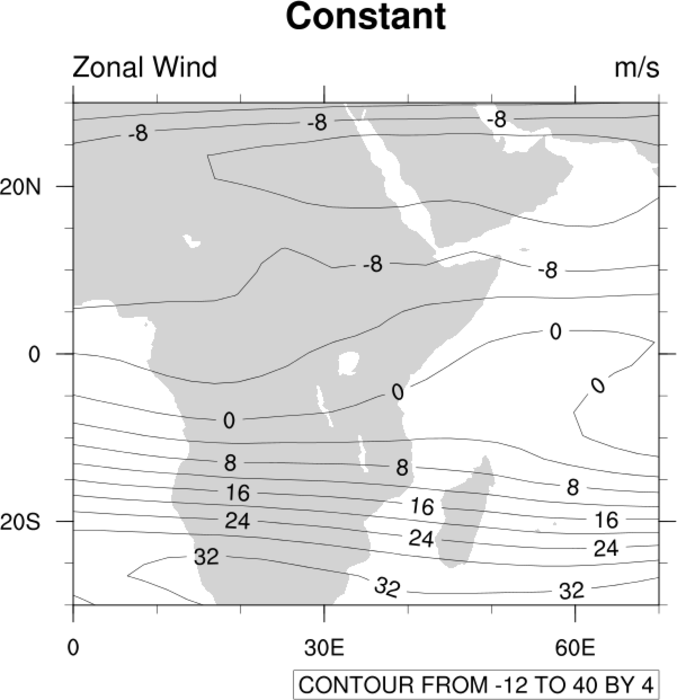
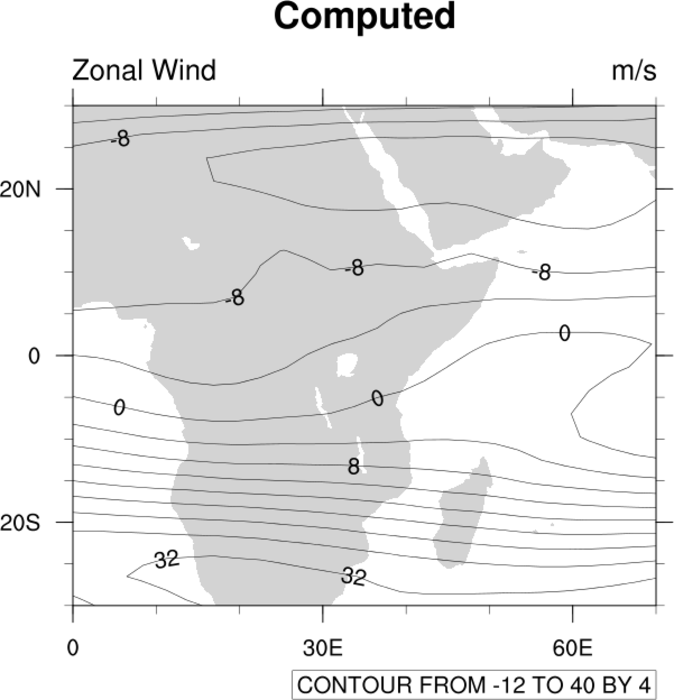
 conLab_1.ncl: Demonstrates the
default behavior of three modes of contour labeling.
conLab_1.ncl: Demonstrates the
default behavior of three modes of contour labeling.
cnLineLabelPlacementMode can be set to randomized (default), constant, or computed. Note that only the constant method makes the label part of the line so that the line is not drawn through it.
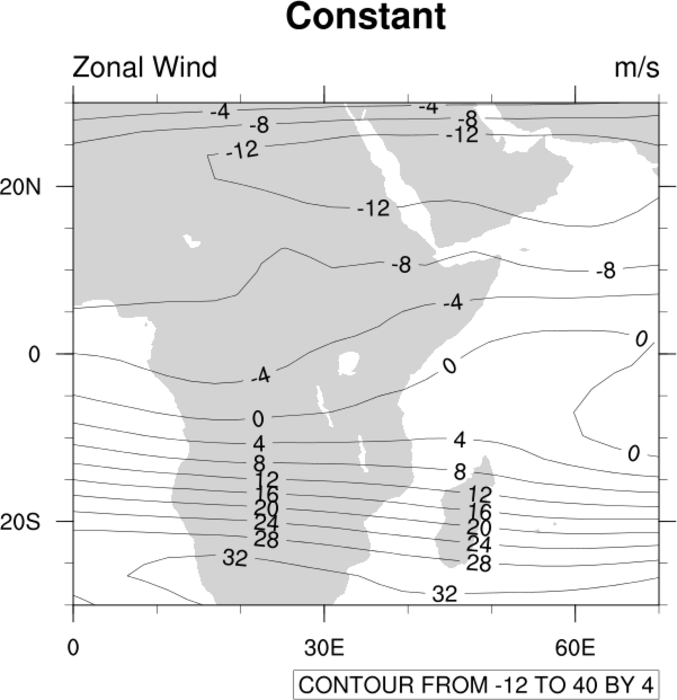
 conLab_2.ncl: Uses several resources
to mimic the behavior of "constant" masking in example 1.
conLab_2.ncl: Uses several resources
to mimic the behavior of "constant" masking in example 1.
The resource cnLabelMasking has been modified (version 4.2.0.a027 or later) that allows the user to mask the contour labels. See the script for the other resources that were used.
 conLab_3.ncl: Uses various resources to modify the
spacing and number of line labels.
conLab_3.ncl: Uses various resources to modify the
spacing and number of line labels.
cnLineLabelInterval determines what sequential contours are labeled. The default is every other contour line (value=2).
cnLineDashSegLenF normally controls the length of dash lines, but it also has an effect on contour labeling when cnLineLabelPlacementMode is set to constant. With this placement mode, the labels are actually part of the line, so cnLineDashSegLenF controls label spacing.
 conLab_4.ncl: Demonstrates
drawing labels with a background color.
conLab_4.ncl: Demonstrates
drawing labels with a background color.
cnLineLabelBackgroundColor allows you to choose a color. The default is transparent. This resource can not be used with a cnLineLabelPlacementMode = constant.
 conLab_5.ncl: Demonstrates a new
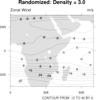
label density resource available since NCL version 4.2.0.a031 or later.
conLab_5.ncl: Demonstrates a new
label density resource available since NCL version 4.2.0.a031 or later.
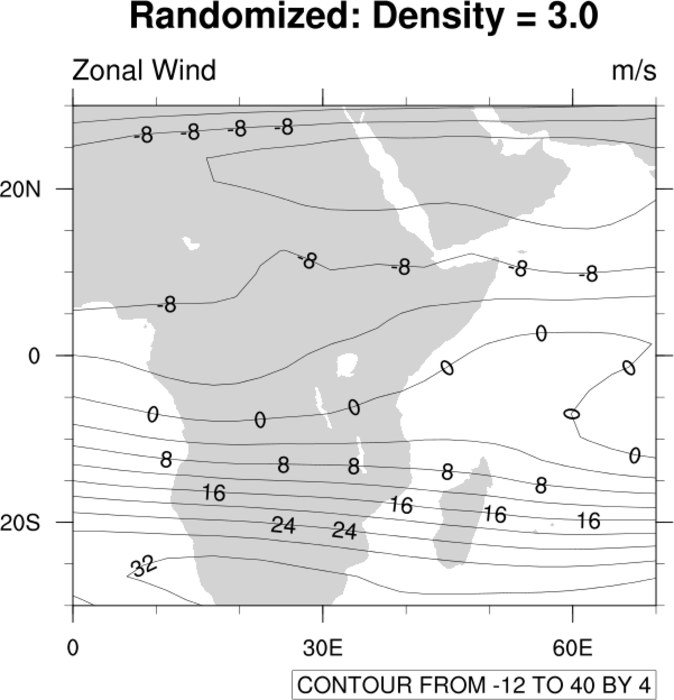
cnLineLabelDensityF can increase or decrease the number of labels along a contour line. The default value for this resource is 0.0, no change. Values greater than 0.0 increase the number of line labels while negative values decrease the number of line labels. The resource does not work if cnLineLabelPlacementMode is set to "constant".
Not that the effect is dependent upon the data to be plotted, the format of the labels, and various other variables. Therefore, there is no general relationship between the value chosen and the number of labels. It will be plot dependent.
 conLab_6.ncl:
Demonstrates how easy it is to alter the appearance and frequency of line labels.
conLab_6.ncl:
Demonstrates how easy it is to alter the appearance and frequency of line labels.
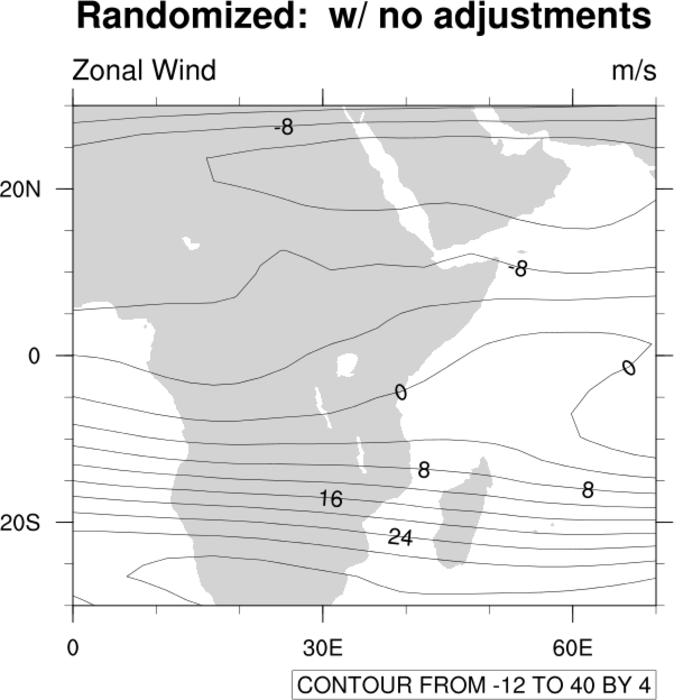
Plot #1 (top) shows the default NCL line labeling. Plot #2 (middle) uses cnLineLabelDensityF to increase the number of line labels, and cnLineLabelInterval to label every line instead of the default every other line. Plot #3 (bottom) uses cnLabelMasking to wipe out the contour line behind each line label, thereby making the line labels easier to read.
 conLab_7.ncl:
Demonstrates how to control which contour lines have labels using
the cnLevelFlags resource.
conLab_7.ncl:
Demonstrates how to control which contour lines have labels using
the cnLevelFlags resource.
 conLab_8.ncl: Shows how
to force the contour line labels to have a certain number
of significant digits, using the
cnLineLabelFormat resource.
conLab_8.ncl: Shows how
to force the contour line labels to have a certain number
of significant digits, using the
cnLineLabelFormat resource.
NCL Graphics: Contour Labels
This page shows how to fine tune your contour labels. It can
be a bit tricky to get the contour labels to appear where you
want, because there is a complicated internal algorithm that
determines the placement of labels.
 conLab_1.ncl: Demonstrates the
default behavior of three modes of contour labeling.
conLab_1.ncl: Demonstrates the
default behavior of three modes of contour labeling.
cnLineLabelPlacementMode can be set to randomized (default), constant, or computed. Note that only the constant method makes the label part of the line so that the line is not drawn through it.
 conLab_2.ncl: Uses several resources
to mimic the behavior of "constant" masking in example 1.
conLab_2.ncl: Uses several resources
to mimic the behavior of "constant" masking in example 1.
The resource cnLabelMasking has been modified (version 4.2.0.a027 or later) that allows the user to mask the contour labels. See the script for the other resources that were used.
 conLab_3.ncl: Uses various resources to modify the
spacing and number of line labels.
conLab_3.ncl: Uses various resources to modify the
spacing and number of line labels.
cnLineLabelInterval determines what sequential contours are labeled. The default is every other contour line (value=2).
cnLineDashSegLenF normally controls the length of dash lines, but it also has an effect on contour labeling when cnLineLabelPlacementMode is set to constant. With this placement mode, the labels are actually part of the line, so cnLineDashSegLenF controls label spacing.
 conLab_4.ncl: Demonstrates
drawing labels with a background color.
conLab_4.ncl: Demonstrates
drawing labels with a background color.
cnLineLabelBackgroundColor allows you to choose a color. The default is transparent. This resource can not be used with a cnLineLabelPlacementMode = constant.
A Python version of this projection is available here.
 conLab_5.ncl: Demonstrates a new
label density resource available since NCL version 4.2.0.a031 or later.
conLab_5.ncl: Demonstrates a new
label density resource available since NCL version 4.2.0.a031 or later.
cnLineLabelDensityF can increase or decrease the number of labels along a contour line. The default value for this resource is 0.0, no change. Values greater than 0.0 increase the number of line labels while negative values decrease the number of line labels. The resource does not work if cnLineLabelPlacementMode is set to "constant".
Not that the effect is dependent upon the data to be plotted, the format of the labels, and various other variables. Therefore, there is no general relationship between the value chosen and the number of labels. It will be plot dependent.
 conLab_6.ncl:
Demonstrates how easy it is to alter the appearance and frequency of line labels.
conLab_6.ncl:
Demonstrates how easy it is to alter the appearance and frequency of line labels. Plot #1 (top) shows the default NCL line labeling. Plot #2 (middle) uses cnLineLabelDensityF to increase the number of line labels, and cnLineLabelInterval to label every line instead of the default every other line. Plot #3 (bottom) uses cnLabelMasking to wipe out the contour line behind each line label, thereby making the line labels easier to read.
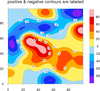
 conLab_7.ncl:
Demonstrates how to control which contour lines have labels using
the cnLevelFlags resource.
conLab_7.ncl:
Demonstrates how to control which contour lines have labels using
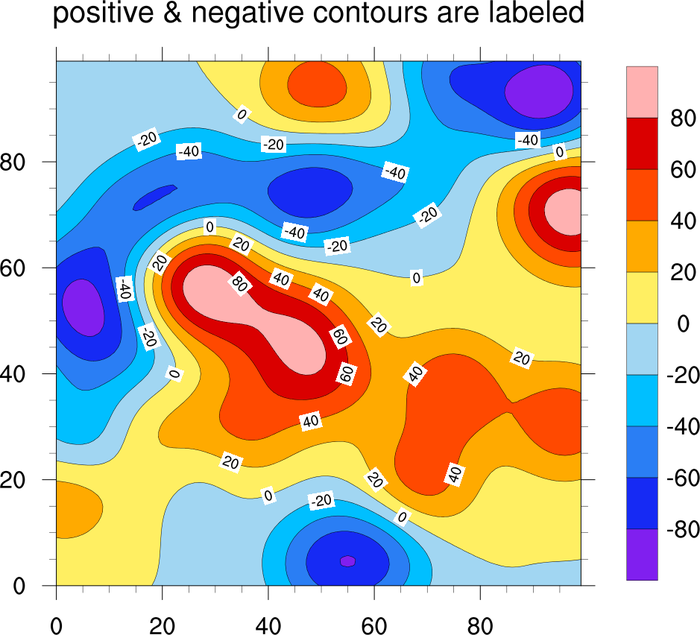
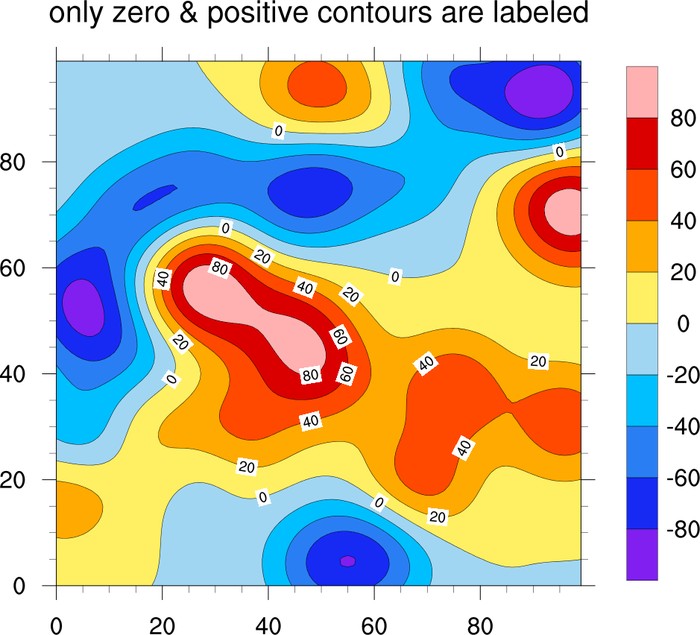
the cnLevelFlags resource.First the plot is created, and getvalues is used to retrieve the contour levels via the cnLevels resource. A new "flags" array is created of the same size as the "levels" array. We loop through the levels and set this "flags" array to "LineOnly" for negative contours, and "LineAndLabel" for zero and positive contours. Finally, setvalues is used to set the cnLevelFlags resource and change the title.
Note: in this case, both the original plot and the modified plot are drawn. If you don't want to draw the first plot, simply set res@gsnDraw and res@gsnFrame to False.
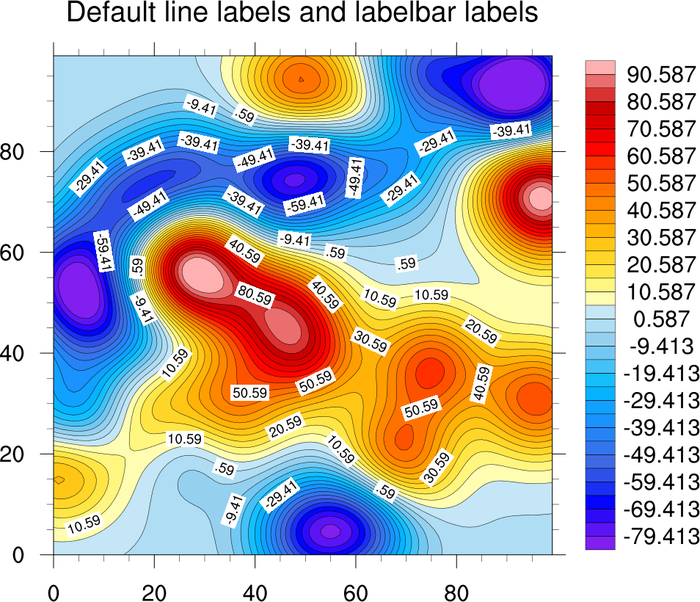
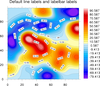
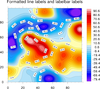
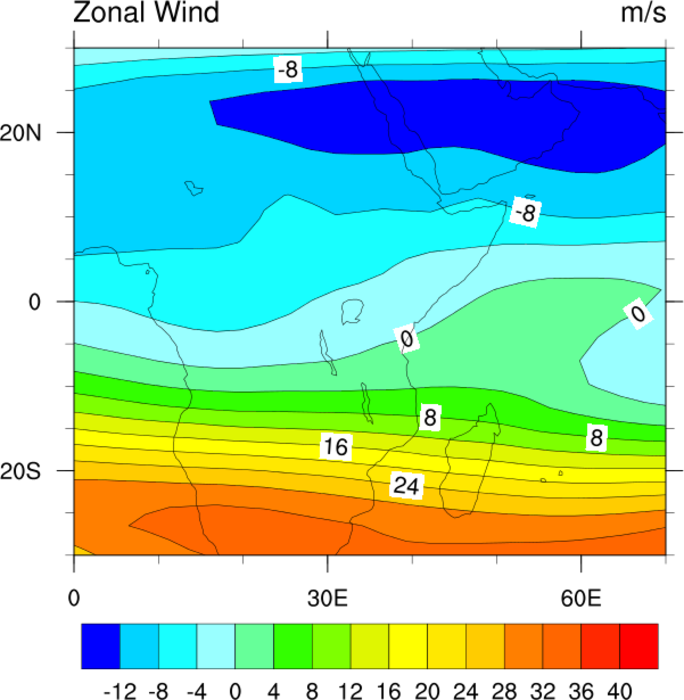
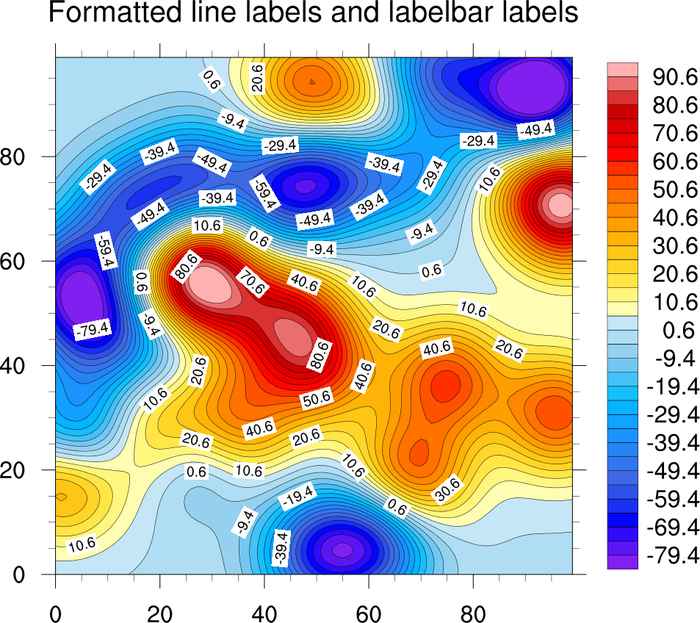 conLab_8.ncl: Shows how
to force the contour line labels to have a certain number
of significant digits, using the
cnLineLabelFormat resource.
conLab_8.ncl: Shows how
to force the contour line labels to have a certain number
of significant digits, using the
cnLineLabelFormat resource.
The first image shows the default labels, and the second image was created by setting both cnLineLabelFormat resource and lbLabelStrings, to format both the contour line labels and the labelbar labels.
The string to use with the cnLineLabelFormat resource can be a bit confusing. See tickmark example tm_8.ncl, which illustrates the various strings you can use. These same strings can be applied for this resource.