NCL Home>
Application examples>
Plot techniques

 conLev_1.ncl:
Demonstrates how to set the contour levels manually.
conLev_1.ncl:
Demonstrates how to set the contour levels manually.
 conLev_2.ncl:
Sets the contours based solely on a user-defined number of contour levels.
conLev_2.ncl:
Sets the contours based solely on a user-defined number of contour levels.
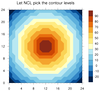
 conLev_3.ncl:
This script demonstrates the meaning of color-filled
contour levels in NCL.
conLev_3.ncl:
This script demonstrates the meaning of color-filled
contour levels in NCL.
 conLev_4.ncl:
Demonstrates how to set the contour levels explicitly.
conLev_4.ncl:
Demonstrates how to set the contour levels explicitly.

 conLev_5.ncl:
Demonstrates how to create contours of a constant field. This
example only works if your data array also contains missing
values. The where function is used set these
missing values to some constant value (that is not equal to the
constant value you already have). This gives NCL two values to
contour.
conLev_5.ncl:
Demonstrates how to create contours of a constant field. This
example only works if your data array also contains missing
values. The where function is used set these
missing values to some constant value (that is not equal to the
constant value you already have). This gives NCL two values to
contour.
 conLev_6.ncl:
Demonstrates how to contour data using exact levels. This
example uses dummy data that has values at exact intervals
from -30 to 100 in steps of 10, and shows how to select
these contour levels and create a labelbar with centered labels.
conLev_6.ncl:
Demonstrates how to contour data using exact levels. This
example uses dummy data that has values at exact intervals
from -30 to 100 in steps of 10, and shows how to select
these contour levels and create a labelbar with centered labels.
NCL Graphics: Contour Levels
This page shows how to change contour levels.
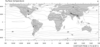
 conLev_1.ncl:
Demonstrates how to set the contour levels manually.
conLev_1.ncl:
Demonstrates how to set the contour levels manually.
cnLevelSelectionMode is set to ManualLevels (default is AutomaticLevels), which allows the user to set the minimum contour level (by using cnMinLevelValF), the maximum contour level (via cnMaxLevelValF), and the contour interval (with cnLevelSpacingF).
A Python version of this projection is available here.
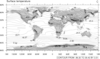
 conLev_2.ncl:
Sets the contours based solely on a user-defined number of contour levels.
conLev_2.ncl:
Sets the contours based solely on a user-defined number of contour levels.
When cnLevelSelectionMode is set to EqualSpacedLevels (default is AutomaticLevels), cnMaxLevelCount can be used to set the number of contour levels. You cannot set cnMinLevelValF, cnMaxLevelValF, or cnLevelSpacingF when using EqualSpacedLevels.
If the data array x is to be plotted, the contour interval is set by the following equation:
(max(x)-min(x))/cnMaxLevelCount = CI
The minimum contour level is then set to min(x)+CI, and the maximum contour level is set to max(x)-CI.
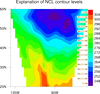
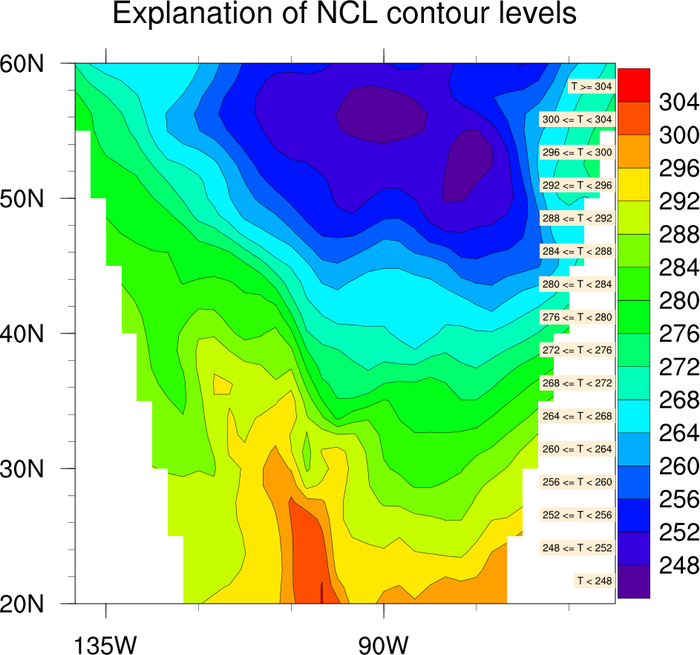 conLev_3.ncl:
This script demonstrates the meaning of color-filled
contour levels in NCL.
conLev_3.ncl:
This script demonstrates the meaning of color-filled
contour levels in NCL.
A Python version of this projection is available here.
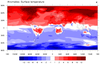
 conLev_4.ncl:
Demonstrates how to set the contour levels explicitly.
conLev_4.ncl:
Demonstrates how to set the contour levels explicitly.
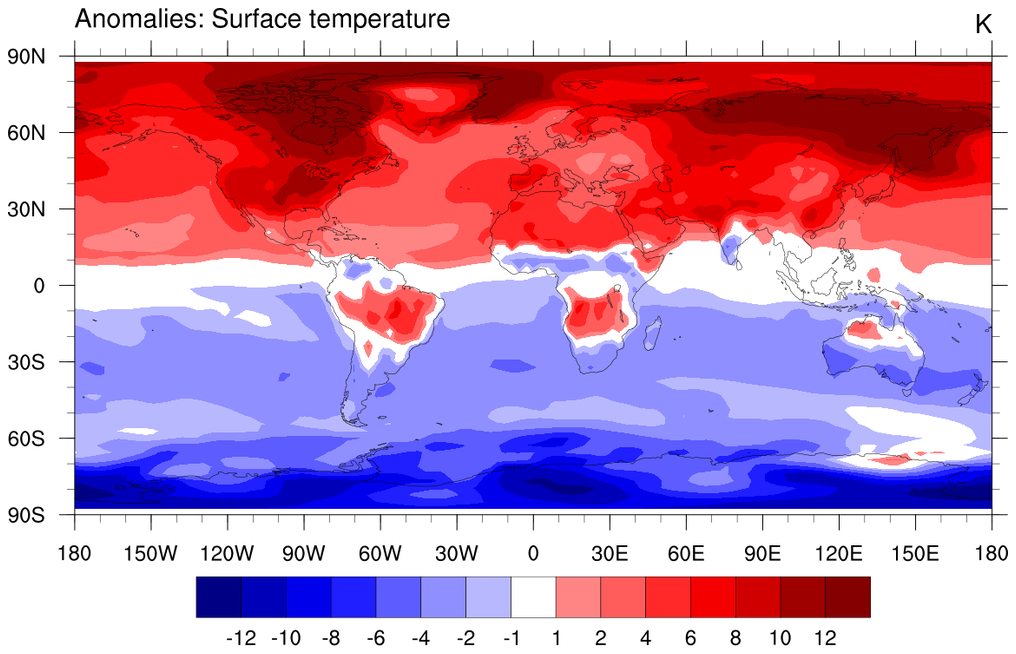
cnLevelSelectionMode is set to ExplicitLevels (default is AutomaticLevels), which allows the user to set the contour levels by using cnLevels. The special value "-1" is used to indicate transparent fill (no fill) for the -1 to 1 range.
cnFillColors is also set here to explicitly set the colors to be used for the color shading.
A Python version of this projection is available here.
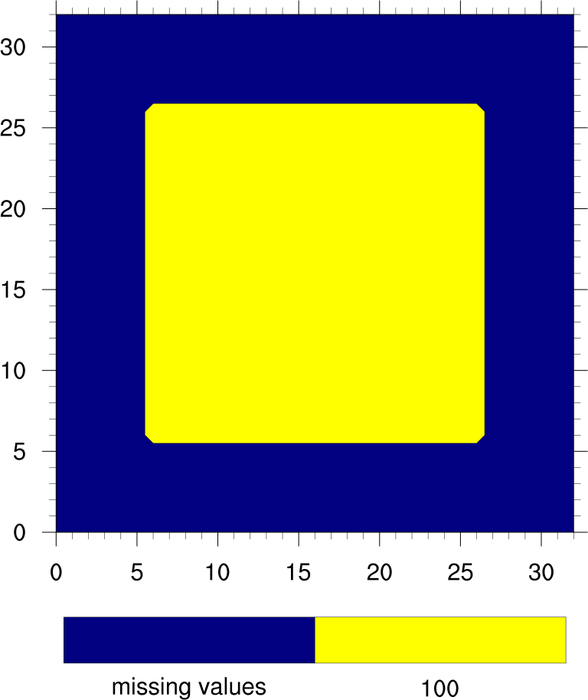
 conLev_5.ncl:
Demonstrates how to create contours of a constant field. This
example only works if your data array also contains missing
values. The where function is used set these
missing values to some constant value (that is not equal to the
constant value you already have). This gives NCL two values to
contour.
conLev_5.ncl:
Demonstrates how to create contours of a constant field. This
example only works if your data array also contains missing
values. The where function is used set these
missing values to some constant value (that is not equal to the
constant value you already have). This gives NCL two values to
contour.
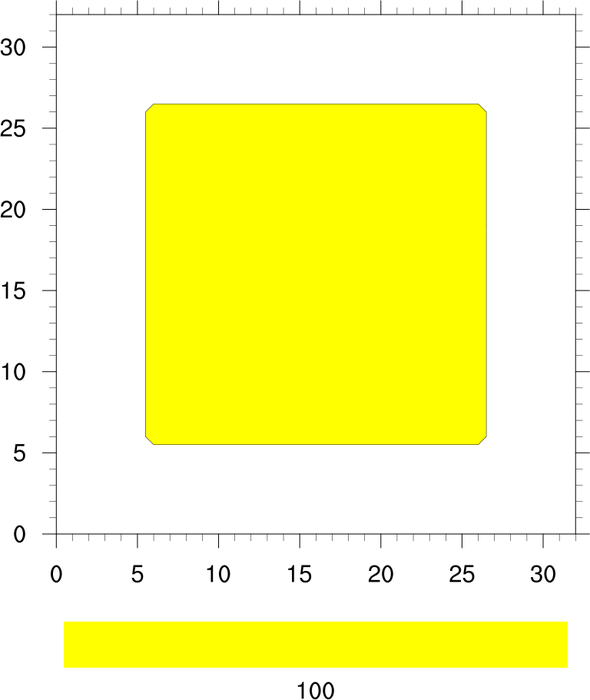
The first frame creates a 2-box labelbar. The second frame creates a 1-box labelbar, by coloring the 2-box labelbar in the same color.
In a future release of NCL, we plan to add a special contour resource that handles constant fields more easily.
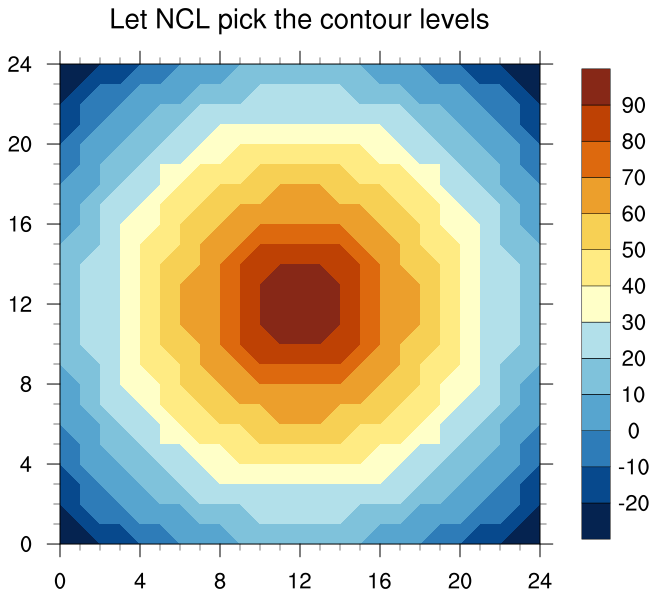
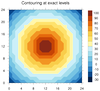
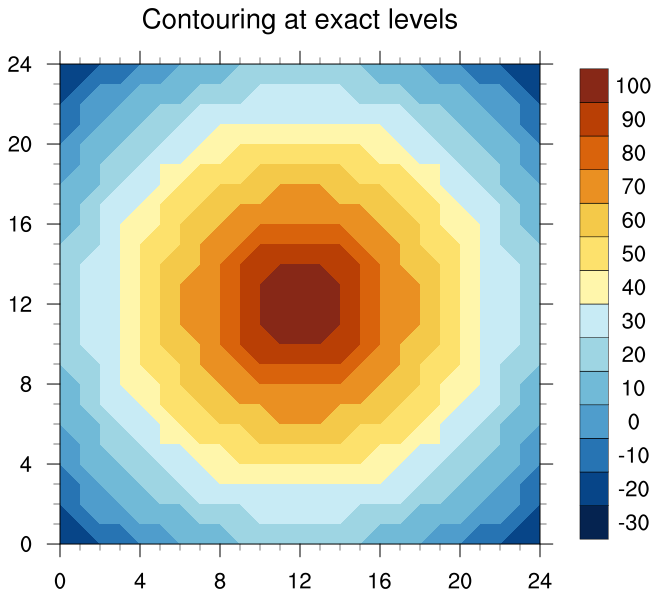 conLev_6.ncl:
Demonstrates how to contour data using exact levels. This
example uses dummy data that has values at exact intervals
from -30 to 100 in steps of 10, and shows how to select
these contour levels and create a labelbar with centered labels.
conLev_6.ncl:
Demonstrates how to contour data using exact levels. This
example uses dummy data that has values at exact intervals
from -30 to 100 in steps of 10, and shows how to select
these contour levels and create a labelbar with centered labels.
The first plot is the default contour plot which lets NCL select the contour levels. The second plot sets the contour levels explicitly, and centers the labelbar labels.
The key is that you need to select one fewer contour levels than what you want, since the contouring in NCL always represents values in a range, and not exactly equal to a value.