Date: Tue Mar 22 2011 - 02:51:30 MDT
Dear WRF users and NCL guys,
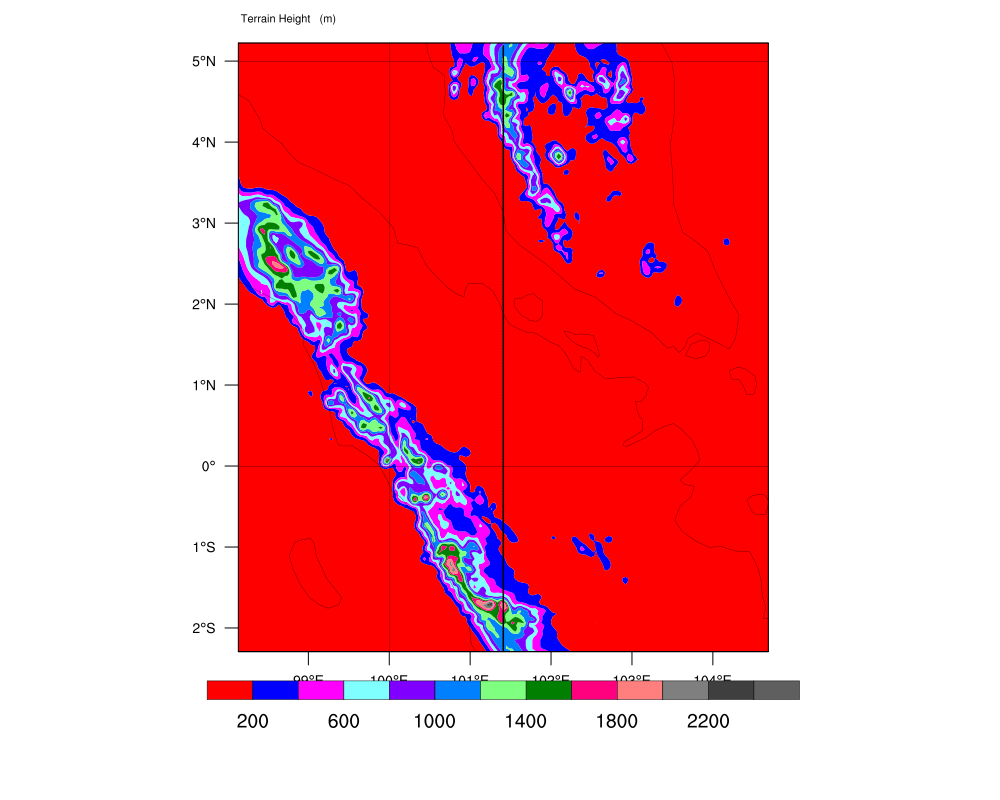
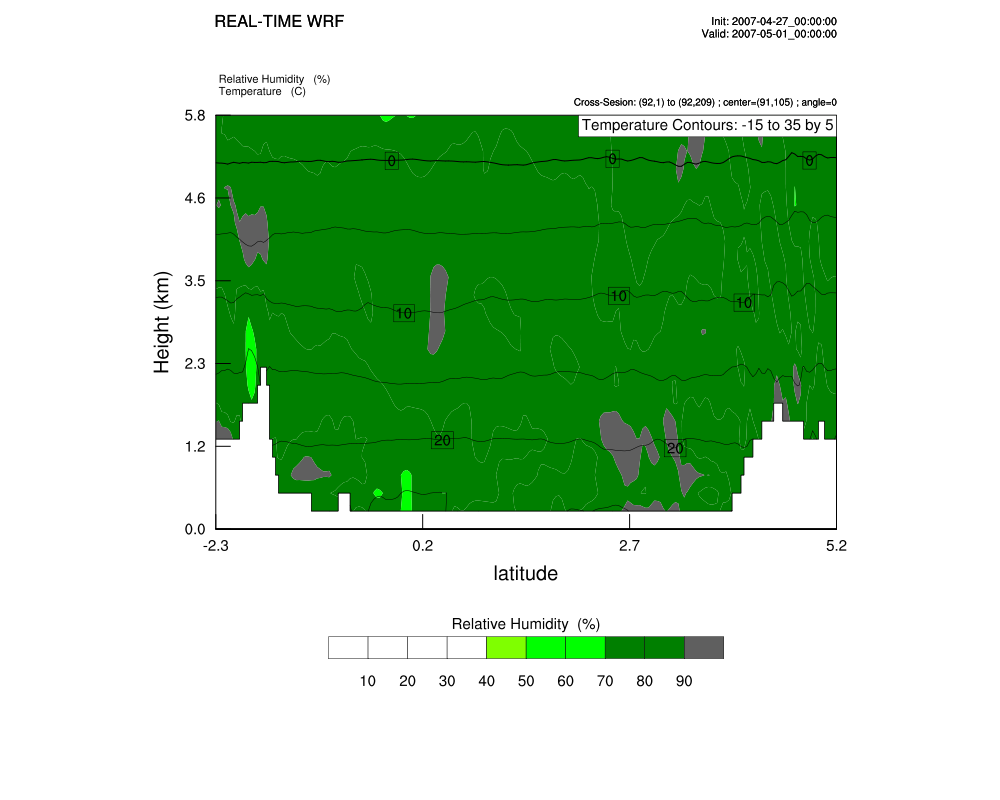
when I use wrf_user_intrp3d in NCL to make a vertical interpolation (in meter), I found the first interpolating level is always missing value. For example my model top is 30 km, then the first interpolating level is 300 meter, and it is always a missing value. As you can from the figure-Z_Vertical_CrossSection.000004.png, the white part in the surface represents the missing value which contaminates the true terrain height.
I will be very appreciated if anyone give me some suggestion.
I copy the script as follows.
Best regards,
Guiting
load "$NCARG_ROOT/lib/ncarg/nclscripts/csm/gsn_code.ncl"
load "$NCARG_ROOT/lib/ncarg/nclscripts/wrf/WRFUserARW.ncl"
;load "./WRFUserARW.ncl"
begin
;
; The WRF ARW input file.
; This needs to have a ".nc" appended, so just do it.
a = addfile("./wrfout.nc<http://wrfout.nc>","r")
; We generate plots, but what kind do we prefer?
type = "x11"
; type = "pdf"
; type = "ps"
; type = "ncgm"
type = "png"
wks = gsn_open_wks(type,"Z_Vertical_CrossSection")
; Set some basic resources
res = True
res@MainTitle = "REAL-TIME WRF"
res@Footer = False
pltres = True
;;;;;;;;;;;;;;;;;;;;;;;;;;;;;;;;;;;;;;;;;;;;;;;;;;;;;;;;;;;;;;;;
;;;;;;;;;;;;;;;;;;;;;;;;;;;;;;;;;;;;;;;;;;;;;;;;;;;;;;;;;;;;;;;;
; What times and how many time steps are in the data set?
FirstTime = True
FirstTimeMap = True
times = wrf_user_list_times(a) ; get times in the file
ntimes = dimsizes(times) ; number of times in the file
;;;;;;;;;;;;;;;;;;;;;;;;;;;;;;;;;;;;;;;;;;;;;;;;;;;;;;;;;;;;;;;;
xlat = wrf_user_getvar(a, "XLAT",0)
xlon = wrf_user_getvar(a, "XLONG",0)
ter = wrf_user_getvar(a, "HGT",0)
do it = 0,ntimes-1,2 ; TIME LOOP
print("Working on time: " + times(it) )
res@TimeLabel = times(it) ; Set Valid time to use on plots
;;;;;;;;;;;;;;;;;;;;;;;;;;;;;;;;;;;;;;;;;;;;;;;;;;;;;;;;;;;;;;;;
; First get the variables we will need
tc = wrf_user_getvar(a,"tc",it) ; T in C
rh = wrf_user_getvar(a,"rh",it) ; relative humidity
z = wrf_user_getvar(a, "z",it) ; grid point height
;;;;;;;;;;;;;;;;;;;;;;;;;;;;;;;;;;;;;;;;;;;;;;;;;;;;;;;;;;;;;;;;
do ip = 1, 3 ; we are doing 3 plots
; all with the pivot point (plane) in the center of the domain
; at angles 0, 45 and 90
; |
; |
; angle=0 is |, angle=90 is ------
; |
; |
; Build plane (pivot point) through which the cross section will go
; OR set to zero, if start and end points are specified
; IF using plane and angle, set opts in wrf_user_intrp3d to False
dimsrh = dimsizes(rh)
plane = new(2,float)
plane = (/ dimsrh(2)/2, dimsrh(1)/2 /) ; pivot point is center of domain
opts = False
if(ip .eq. 1) then
angle = 90.
X_plane = wrf_user_intrp2d(xlon,plane,angle,opts)
X_desc = "longitude"
end if
if(ip .eq. 2) then
angle = 0.
X_plane = wrf_user_intrp2d(xlat,plane,angle,opts)
X_desc = "latitude"
end if
if(ip .eq. 3) then
angle = 45.
X_plane = wrf_user_intrp2d(xlon,plane,angle,opts)
X_desc = "longitude"
end if
; X-axis lables
dimsX = dimsizes(X_plane)
xmin = X_plane(0)
xmax = X_plane(dimsX(0)-1)
xspan = dimsX(0)-1
nxlabs = floattoint( (xmax-xmin)/2 + 1)
if (FirstTimeMap) then
lat_plane = wrf_user_intrp2d(xlat,plane,angle,opts)
lon_plane = wrf_user_intrp2d(xlon,plane,angle,opts)
mpres = True
mpres@mpGeophysicalLineColor = "Black"
mpres@mpNationalLineColor = "Black"
mpres@mpUSStateLineColor = "Black"
mpres@mpGridLineColor = "Black"
mpres@mpLimbLineColor = "Black"
mpres@mpPerimLineColor = "Black"
pltres = True
pltres@FramePlot = False
optsM = res
optsM@NoHeaderFooter = True
optsM@cnFillOn = True
optsM@lbTitleOn = False
contour = wrf_contour(a,wks,ter,optsM)
plot = wrf_map_overlays(a,wks,(/contour/),pltres,mpres)
lnres = True
lnres@gsLineThicknessF = 3.0
lnres@gsLineColor = "black";"Red"
do ii = 0,dimsX(0)-2
gsn_polyline(wks,plot,(/lon_plane(ii),lon_plane(ii+1)/),(/lat_plane(ii),lat_plane(ii+1)/),lnres)
end do
frame(wks)
delete(lon_plane)
delete(lat_plane)
pltres@FramePlot = True
end if
if (FirstTime) then
; THIS IS NEEDED FOR LABLES - ALWAYS DO (Z axis only needed once. X everytime plane changes)
; Y-axis labels
zmax = 6000. ; We only want to see the first 6 km
zz = wrf_user_intrp3d(z,z,"v",plane,angle,opts)
dims = dimsizes(zz)
do imax = 0,dims(0)-1
if ( .not.ismissing(zz(imax,0)) .and. zz(imax,0) .lt. zmax ) then
zmax_pos = imax
end if
end do
zspan = zmax_pos
zmin = z(0,0,0)
zmax = zz(zmax_pos,0)
print(zmax)
zmin=zmin/1000.
zmax=zmax/1000.
nzlabs = floattoint(zmax + 1)
FirstTime = False
; END OF ALWAYS DO
end if
; Interpolate data vertically (in z)
rh_plane = wrf_user_intrp3d(rh,z,"v",plane,angle,opts)
tc_plane = wrf_user_intrp3d(tc,z,"v",plane,angle,opts)
; Options for XY Plots
opts_xy = res
opts_xy@tiXAxisString = X_desc
opts_xy@tiYAxisString = "Height (km)"
opts_xy@cnMissingValPerimOn = True
opts_xy@cnMissingValFillColor = 0
opts_xy@cnMissingValFillPattern = 11
opts_xy@tmXTOn = False
opts_xy@tmYROn = False
opts_xy@tmXBMode = "Explicit"
opts_xy@tmXBValues = fspan(0,xspan,nxlabs) ; Create the correct tick marks
opts_xy@tmXBLabels = sprintf("%.1f",fspan(xmin,xmax,nxlabs)); Create labels
opts_xy@tmXBLabelFontHeightF = 0.015
opts_xy@tmYLMode = "Explicit"
opts_xy@tmYLValues = fspan(0,zspan,nzlabs) ; Create the correct tick marks
opts_xy@tmYLLabels = sprintf("%.1f",fspan(zmin,zmax,nzlabs)); Create labels
opts_xy@tiXAxisFontHeightF = 0.020
opts_xy@tiYAxisFontHeightF = 0.020
opts_xy@tmXBMajorLengthF = 0.02
opts_xy@tmYLMajorLengthF = 0.02
opts_xy@tmYLLabelFontHeightF = 0.015
opts_xy@PlotOrientation = tc_plane@Orientation
; Plotting options for RH
opts_rh = opts_xy
opts_rh@ContourParameters = (/ 10., 90., 10. /)
opts_rh@pmLabelBarOrthogonalPosF = -0.1
opts_rh@cnFillOn = True
opts_rh@cnFillColors = (/"White","White","White", \
"White","Chartreuse","Green", \
"Green3","Green4", \
"ForestGreen","PaleGreen4"/)
; Plotting options for Temperature
opts_tc = opts_xy
opts_tc@cnInfoLabelZone = 1
opts_tc@cnInfoLabelSide = "Top"
opts_tc@cnInfoLabelPerimOn = True
opts_tc@cnInfoLabelOrthogonalPosF = -0.00005
opts_tc@ContourParameters = (/ 5. /)
; Get the contour info for the rh and temp
contour_tc = wrf_contour(a,wks,tc_plane(0:zmax_pos,:),opts_tc)
contour_rh = wrf_contour(a,wks,rh_plane(0:zmax_pos,:),opts_rh)
; MAKE PLOTS
plot = wrf_overlays(a,wks,(/contour_rh,contour_tc/),pltres)
; Delete options and fields, so we don't have carry over
delete(opts_xy)
delete(opts_tc)
delete(opts_rh)
delete(tc_plane)
delete(rh_plane)
delete(X_plane)
end do ; make next cross section
;;;;;;;;;;;;;;;;;;;;;;;;;;;;;;;;;;;;;;;;;;;;;;;;;;;;;;;;;;;;;;;;
FirstTimeMap = False
end do ; END OF TIME LOOP
end
________________________________
CONFIDENTIALITY: This email is intended solely for the person(s) named and may be confidential and/or privileged. If you are not the intended recipient, please delete it, notify us and do not copy, use, or disclose its content. Thank you.
Towards A Sustainable Earth: Print Only When Necessary
_______________________________________________
ncl-talk mailing list
List instructions, subscriber options, unsubscribe:
http://mailman.ucar.edu/mailman/listinfo/ncl-talk