Date: Wed Mar 30 2011 - 22:05:41 MDT
Hi NCL Team,
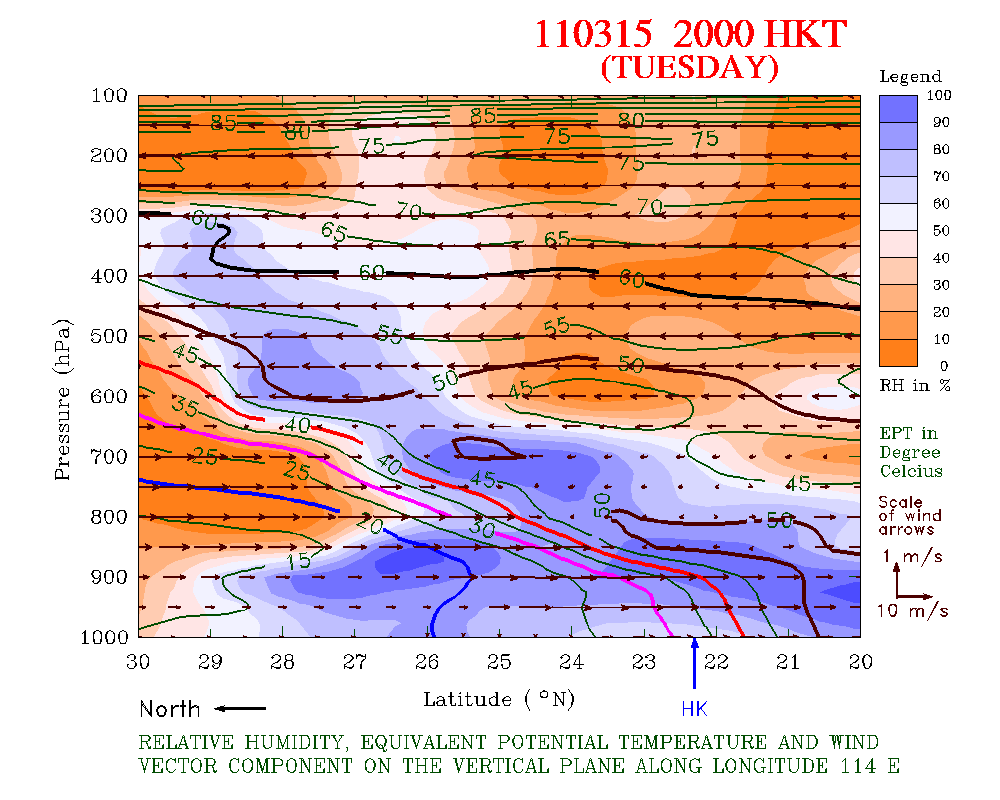
I would like to study the feasibility of plotting an image in pressure vs
latitude coordinates (attachment is the example). I need to extract data
from grib files, but I guess I have to "convert" the elements inside in
advance before I can use "gsn_csm_pres_hgt" for the plot.
The element extracted from the grib files is a 3d array
Dimensions and sizes: [lv_ISBL2 | 16] x [g0_lat_0 | 348] x [g0_lon_1 |
568]
Coordinates:
lv_ISBL2: [100..1000]
g0_lat_0: [42.1..7.4]
g0_lon_1: [89.9..146.6]
I tried to put the array to the function "vinth2p" but it looked like it is
not a correct approach.
*fatal:vinth2p: Surface pressure must have same number of [case], [time],
lat and lon elements as first input argument; number of dimensions do not
match.*
Any suggestion? Let me know if you want to take a look at the grib file I
got.
Thanks for your help!
Samuel Leung
_______________________________________________
ncl-talk mailing list
List instructions, subscriber options, unsubscribe:
http://mailman.ucar.edu/mailman/listinfo/ncl-talk