Date: Thu Mar 31 2011 - 05:14:40 MDT
Dennis,
Thanks for your reply! So I think I need not use vinth2p...
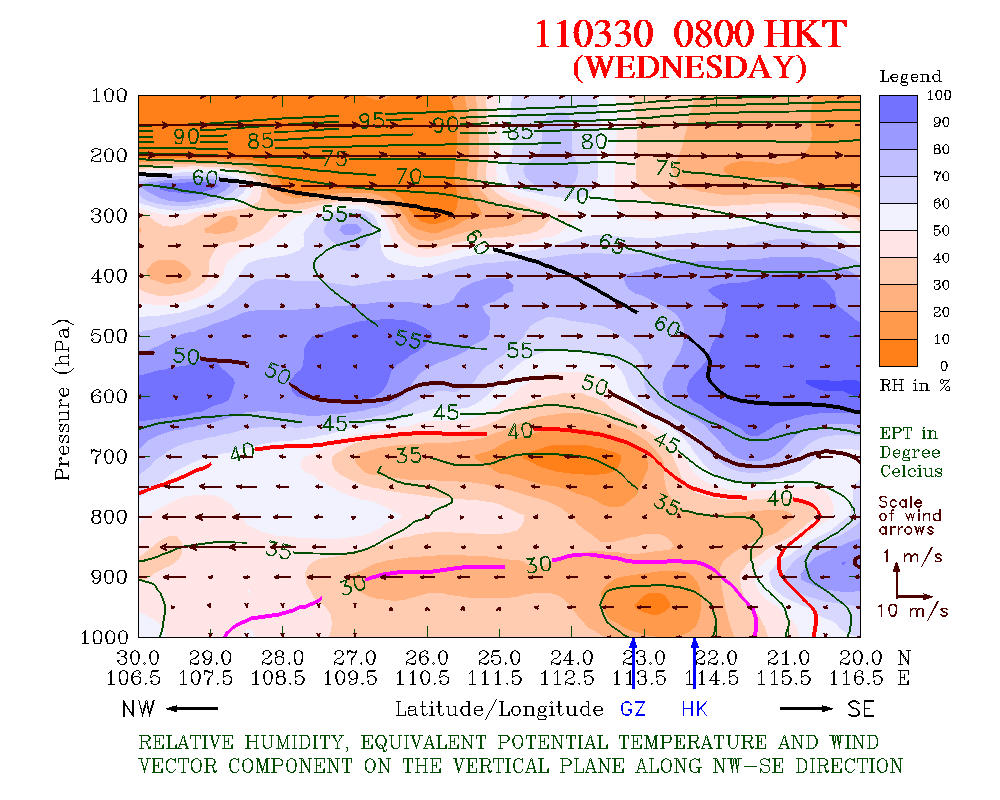
Now what if I want to plot a cross section along NW-SE direction? (example
attached)
Can gsn_csm_pres_hgt_vector and gsn_csm_pres_hgt work with this style of
plot?
And, for the function gsn_csm_pres_hgt_vector, do I have to put the
parameter zcomp? I saw some of the examples from website use omega, but I do
not have such attribute in my data source. Can I use east-west (u) component
of wind to replace it when working on press/height vs latitude plot?
Thanks,
Samuel Leung
On Thu, Mar 31, 2011 at 12:49 PM, Dennis Shea <shea@ucar.edu> wrote:
> The data are alreay on pressure levels.
> Why are you using vinth2p??
> ===============
> http://www.ncl.ucar.edu/Applications/height_lat.shtml
>
> EG Example 6
> ;***********************
> ; h_lat_6.ncl
> ;***********************
> load "$NCARG_ROOT/lib/ncarg/nclscripts/csm/gsn_code.ncl"
> load "$NCARG_ROOT/lib/ncarg/nclscripts/csm/gsn_csm.ncl"
> ;***********************
> begin
> LON = 100
>
> f = addfile ("foo.grb","r")
> x = f->X(:,:{LON}) ; read pressure and latitudes at LON
> printVarSummary(x)
>
> ;***********************
> ; Create Plot
> ;***********************
> wks = gsn_open_wks ("ps", "h_lat" ) ; open workstation
> gsn_define_colormap(wks,"amwg") ; choose colormap
>
>
> res = True ; plot mods desired
>
> :res@cnLevelSelectionMode = "ManualLevels" ; manually select levels
> ;res@cnLevelSpacingF = 5.0 ; contour spacing
> ;res@cnMinLevelValF = -50. ; min level
> ;res@cnMaxLevelValF = 50. ; max level
> res@cnLineLabelsOn = True ; turn on line labels
> res@cnFillOn = True ; turn on color fill
> res@gsnSpreadColors = True ; use full range of map
> res@lbLabelAutoStride = True ; optimal labels
>
> plot = gsn_csm_pres_hgt(wks, x, res ) ; plaace holder
>
> end
>
>
>
> On 3/30/11 10:05 PM, Leung Samuel wrote:
>
>> Hi NCL Team,
>>
>> I would like to study the feasibility of plotting an image in pressure
>> vs latitude coordinates (attachment is the example). I need to extract
>> data from grib files, but I guess I have to "convert" the elements
>> inside in advance before I can use "gsn_csm_pres_hgt" for the plot.
>>
>> The element extracted from the grib files is a 3d array
>> Dimensions and sizes: [lv_ISBL2 | 16] x [g0_lat_0 | 348] x [g0_lon_1 |
>> 568]
>> Coordinates:
>> lv_ISBL2: [100..1000]
>> g0_lat_0: [42.1..7.4]
>> g0_lon_1: [89.9..146.6]
>>
>> I tried to put the array to the function "vinth2p" but it looked like it
>> is not a correct approach.
>> /fatal:vinth2p: Surface pressure must have same number of [case],
>> [time], lat and lon elements as first input argument; number of
>> dimensions do not match./
>>
>> Any suggestion? Let me know if you want to take a look at the grib file
>> I got.
>>
>> Thanks for your help!
>>
>> Samuel Leung
>>
>>
>>
>> _______________________________________________
>> ncl-talk mailing list
>> List instructions, subscriber options, unsubscribe:
>> http://mailman.ucar.edu/mailman/listinfo/ncl-talk
>>
>
_______________________________________________
ncl-talk mailing list
List instructions, subscriber options, unsubscribe:
http://mailman.ucar.edu/mailman/listinfo/ncl-talk