Date: Fri Apr 01 2011 - 03:35:26 MDT
ncl-talk,
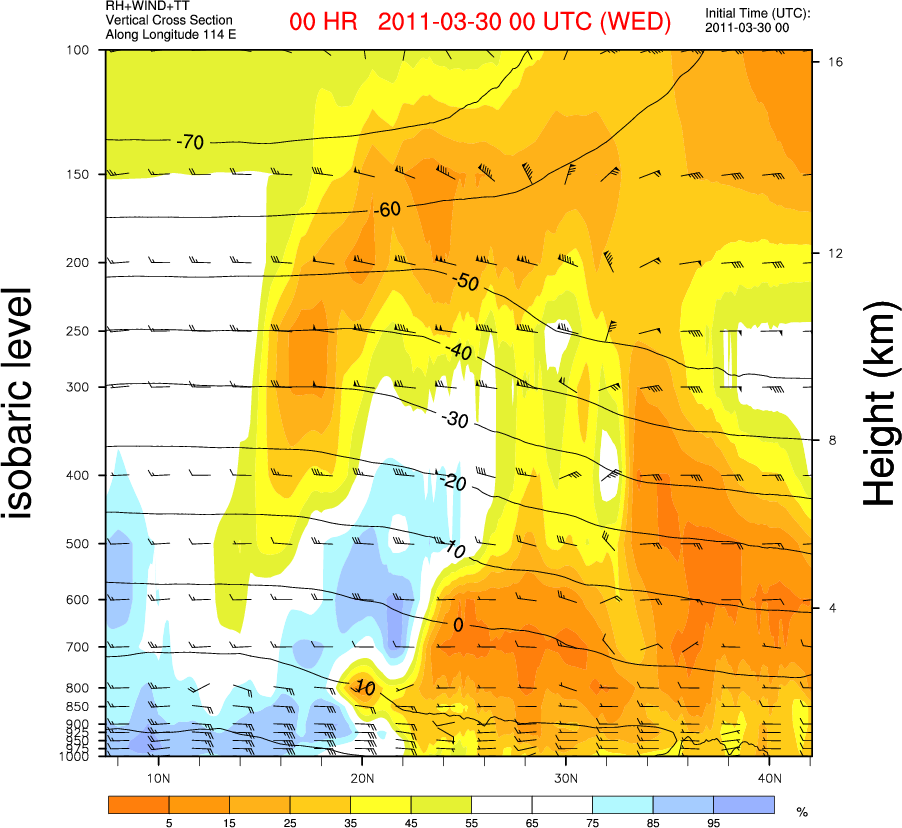
I would like to use the fixed y-axis scale on the press/height vs latitude
plot. Please take a look at the attached image. Currently it follows the
fixed scale of right y-axis (i.e. the height). The lower levels (those
800~1000hPa) are packed too much.
Is there a way to arrange the tickmarks of left y-axis instead of right
y-axis in equal/customized width? I checked the example "axes_1.ncl" in
http://www.ncl.ucar.edu/Applications/axes.shtml but the function
gsnYAxisIrregular2Linear did not work in my script.
My script is also attached for your reference.
Thanks a lot.
Regards,
Samuel Leung
_______________________________________________
ncl-talk mailing list
List instructions, subscriber options, unsubscribe:
http://mailman.ucar.edu/mailman/listinfo/ncl-talk
- application/octet-stream attachment: vcrn.ncl