NCL Home>
Application examples>
Plot techniques ||
Data files for some examples
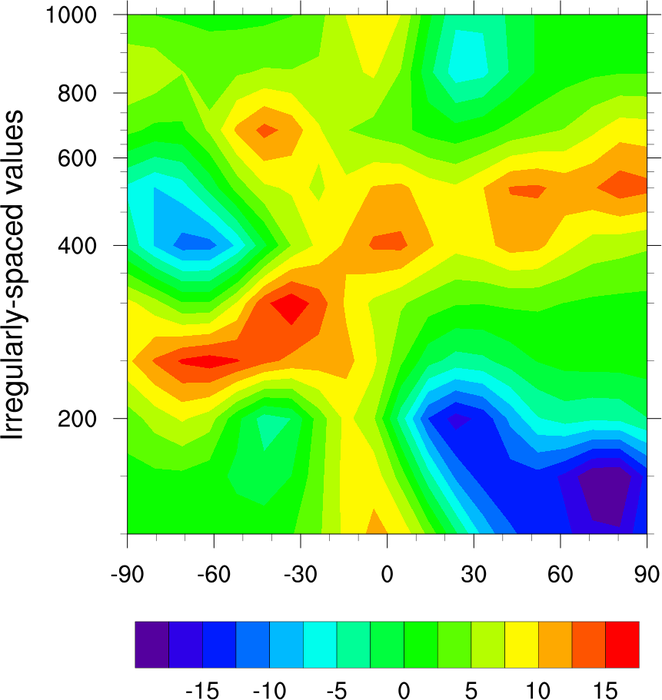
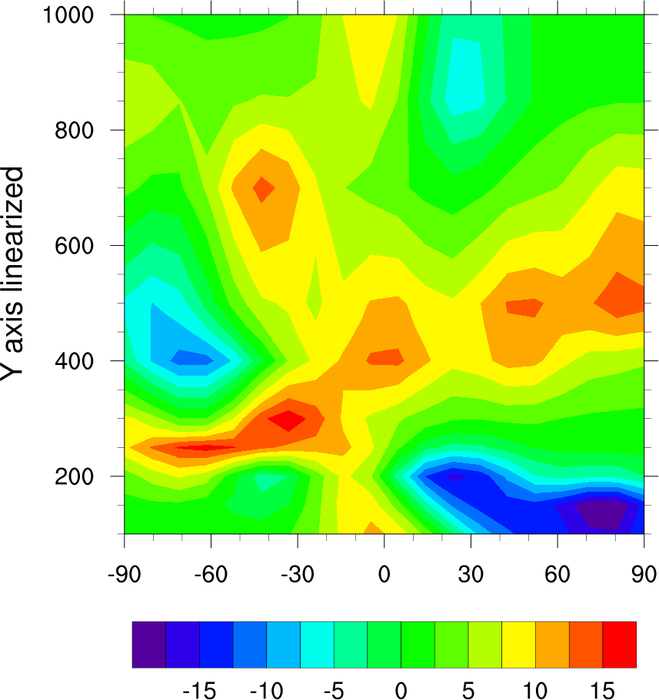
 axes_1.ncl: This is a simple script
that uses dummy data with a Y axis that has irregularly-spaced
values. The second frame shows how setting gsnYAxisIrregular2Linear to True will linearize
the Y axis. Note what this does to the contours.
axes_1.ncl: This is a simple script
that uses dummy data with a Y axis that has irregularly-spaced
values. The second frame shows how setting gsnYAxisIrregular2Linear to True will linearize
the Y axis. Note what this does to the contours.
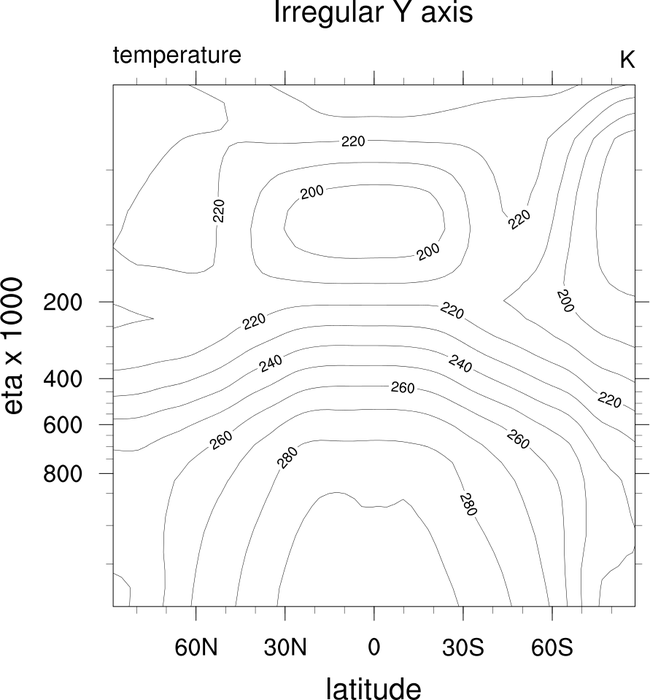
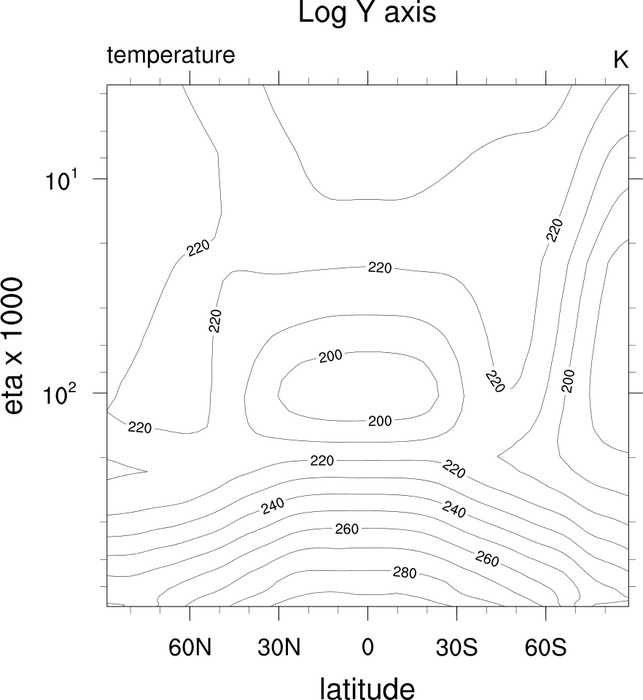
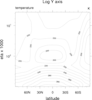 axes_2.ncl: This script shows how to
convert an irregular axis to a log axis by setting gsnYAxisIrregular2Log to True.
axes_2.ncl: This script shows how to
convert an irregular axis to a log axis by setting gsnYAxisIrregular2Log to True.
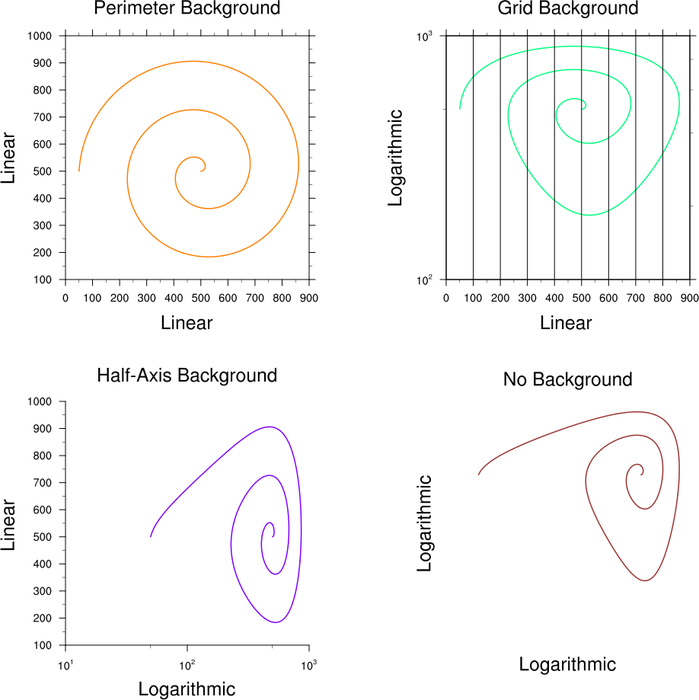
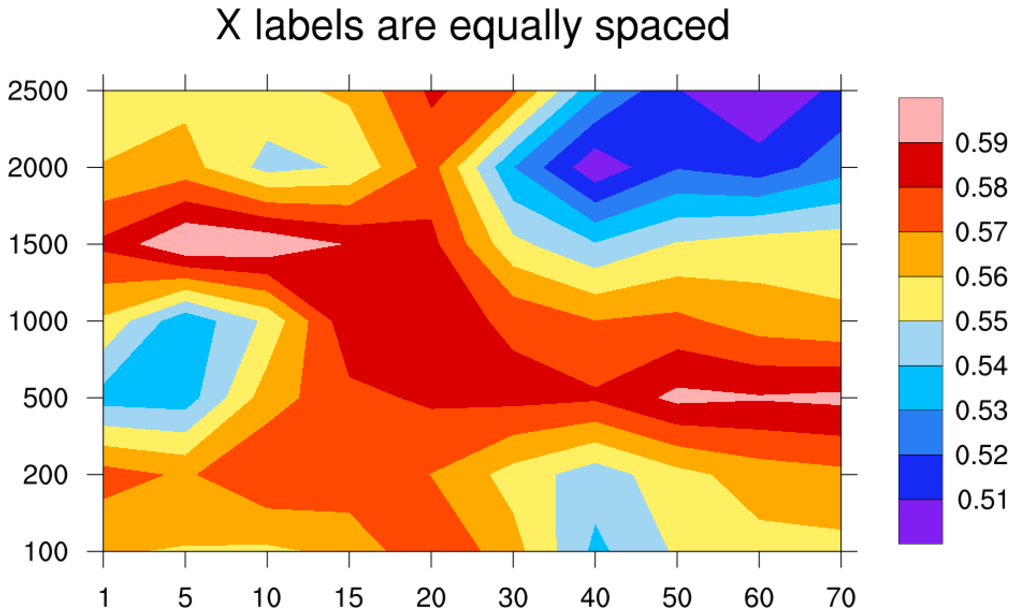
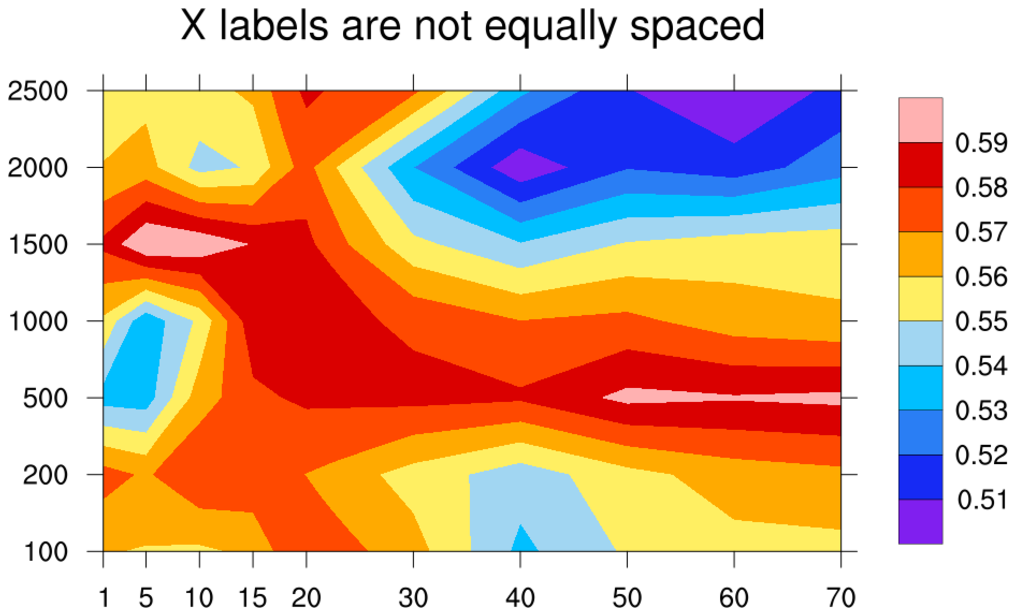
 axes_3.ncl: This script
shows various ways you can control all four axes of
a plot. Although this is an XY plot, these techniques apply
for contour and vector plots as well.
axes_3.ncl: This script
shows various ways you can control all four axes of
a plot. Although this is an XY plot, these techniques apply
for contour and vector plots as well.
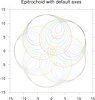
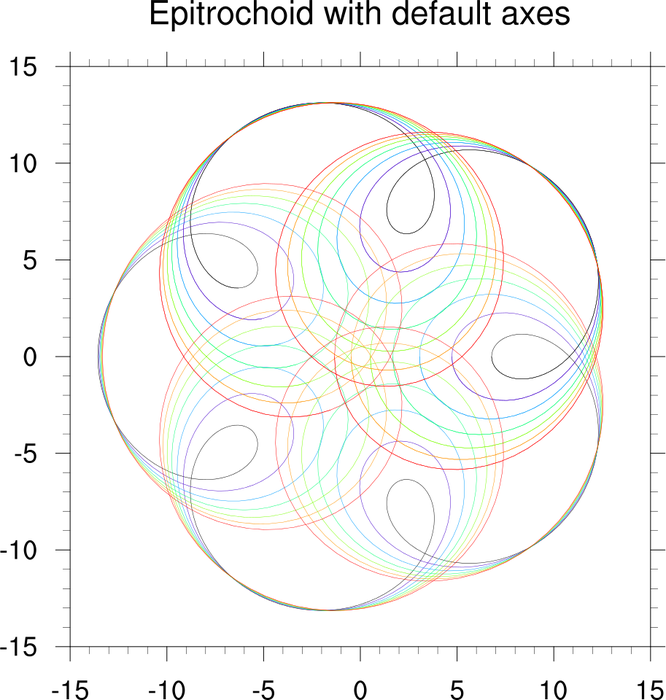
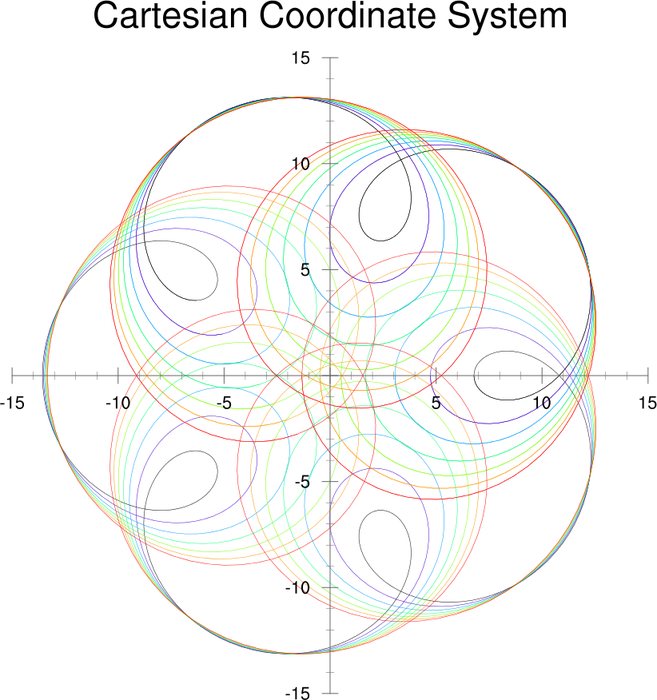
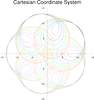 axes_4.ncl: This script
shows how to replace the default axes with a cartesian coordinate
system.
axes_4.ncl: This script
shows how to replace the default axes with a cartesian coordinate
system.
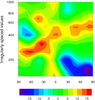
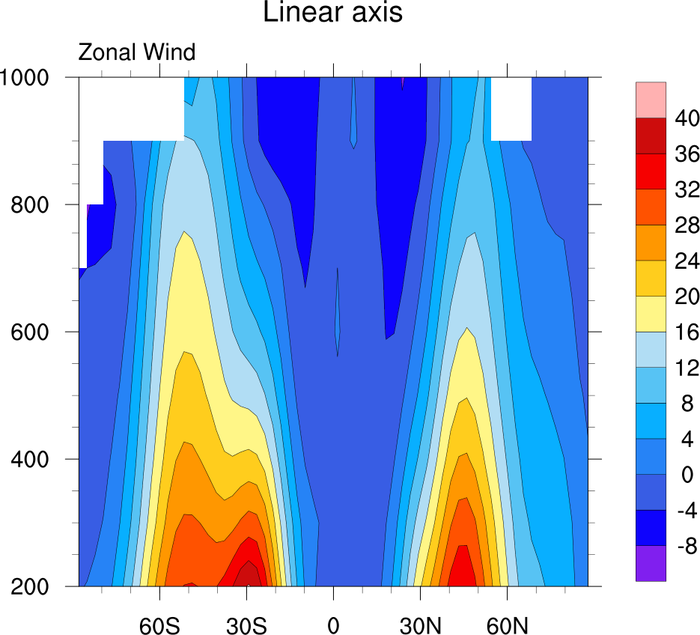
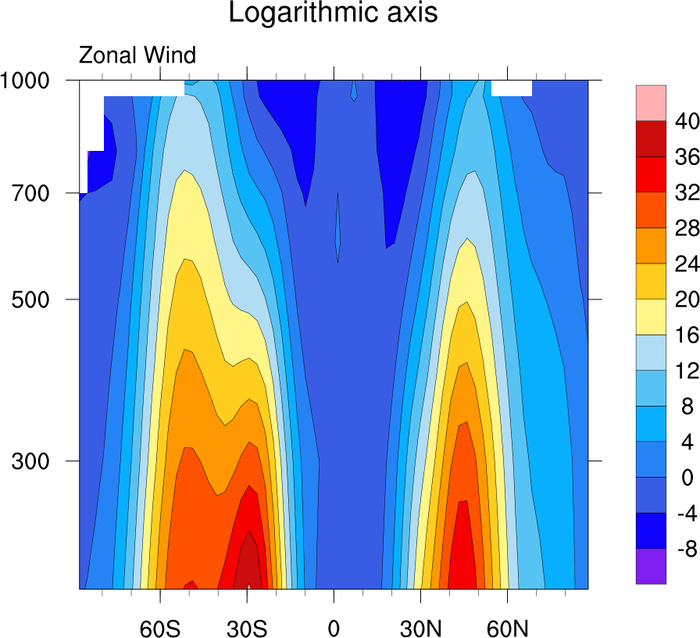
 axes_5.ncl: This script shows how to
convert a linear axis to a logarithmic axis in a contour plot, by
setting gsnYAxisIrregular2Log to True.
axes_5.ncl: This script shows how to
convert a linear axis to a logarithmic axis in a contour plot, by
setting gsnYAxisIrregular2Log to True.
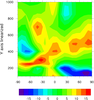
 axes_6.ncl: This script shows how to
increase the range of the X and Y axes of a contour plot that has
coordinate values set.
axes_6.ncl: This script shows how to
increase the range of the X and Y axes of a contour plot that has
coordinate values set.
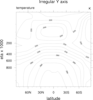
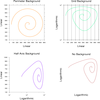
 axes_7.ncl: This script creates a
plot of dummy data that has both irregular X and Y coordinate
arrays. It then linearizes the X axis by
setting gsnXAxisIrregular2Linear to True.
axes_7.ncl: This script creates a
plot of dummy data that has both irregular X and Y coordinate
arrays. It then linearizes the X axis by
setting gsnXAxisIrregular2Linear to True.
Example pages containing: tips | resources | functions/procedures
NCL Graphics: Axes
This page shows how to control the axes of any plot, like linearizing
an irregular axis, converting one to a log axis, and turning off
borders and/or tickmarks.
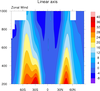
 axes_1.ncl: This is a simple script
that uses dummy data with a Y axis that has irregularly-spaced
values. The second frame shows how setting gsnYAxisIrregular2Linear to True will linearize
the Y axis. Note what this does to the contours.
axes_1.ncl: This is a simple script
that uses dummy data with a Y axis that has irregularly-spaced
values. The second frame shows how setting gsnYAxisIrregular2Linear to True will linearize
the Y axis. Note what this does to the contours.
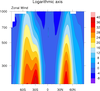
 axes_2.ncl: This script shows how to
convert an irregular axis to a log axis by setting gsnYAxisIrregular2Log to True.
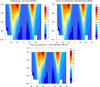
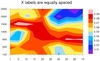
axes_3.ncl: This script
shows various ways you can control all four axes of
a plot. Although this is an XY plot, these techniques apply
for contour and vector plots as well.
axes_2.ncl: This script shows how to
convert an irregular axis to a log axis by setting gsnYAxisIrregular2Log to True.
axes_3.ncl: This script
shows various ways you can control all four axes of
a plot. Although this is an XY plot, these techniques apply
for contour and vector plots as well.
 axes_4.ncl: This script
shows how to replace the default axes with a cartesian coordinate
system.
axes_4.ncl: This script
shows how to replace the default axes with a cartesian coordinate
system.
If you want to be sure that point (0,0) is the center of the cartesian axes, then you can either modify the "attach_vert_axis" and "attach_horiz_axis" functions in this script, or do it the "lazy" way by setting:
res@trXMinF = -(max(x))
res@trXMaxF = (max(x))
res@trYMinF = -(max(y))
res@trYMaxF = (max(y))
Where "x" and "y" represent the range of your X and Y axes.
 axes_5.ncl: This script shows how to
convert a linear axis to a logarithmic axis in a contour plot, by
setting gsnYAxisIrregular2Log to True.
axes_5.ncl: This script shows how to
convert a linear axis to a logarithmic axis in a contour plot, by
setting gsnYAxisIrregular2Log to True.
Note that the original Y axis looks linear, but is considered "irregular" because it has a coordinate array. Hence, the gsnYAxisIrregular2Log will work.
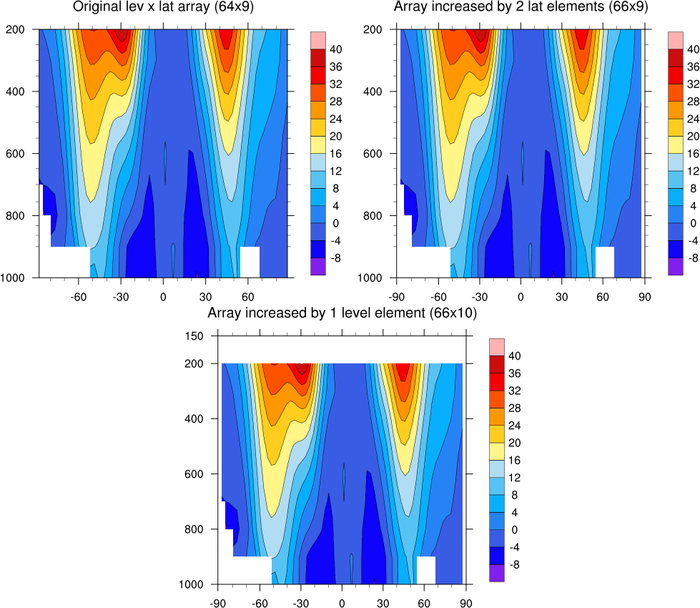 axes_6.ncl: This script shows how to
increase the range of the X and Y axes of a contour plot that has
coordinate values set.
axes_6.ncl: This script shows how to
increase the range of the X and Y axes of a contour plot that has
coordinate values set.
If you try to set any of trXMinF, trXMaxF, trYMinF, and/or trYMaxF to a value outside the range of the data's coordinate values, then you will get an error:
warning:ContourPlotSetValues: current transformation requires trXMinF
     to be within data coordinate range: resetting
In this example, the original latitude coordinate array goes from
-87.86 to 87.86, and the level array from 200 to 1000. We show how to
use the new function to increase the latitude array
by two elements, -90 and 90, and the level array by one element, 150
mb. The data array is also increased by 2 elements in the lat
dimension, and 1 element in the level dimension.
 axes_7.ncl: This script creates a
plot of dummy data that has both irregular X and Y coordinate
arrays. It then linearizes the X axis by
setting gsnXAxisIrregular2Linear to True.
axes_7.ncl: This script creates a
plot of dummy data that has both irregular X and Y coordinate
arrays. It then linearizes the X axis by
setting gsnXAxisIrregular2Linear to True.
Note the change in the plot along the horizontal direction.