Date: Wed Apr 13 2011 - 20:09:30 MDT
Hello,
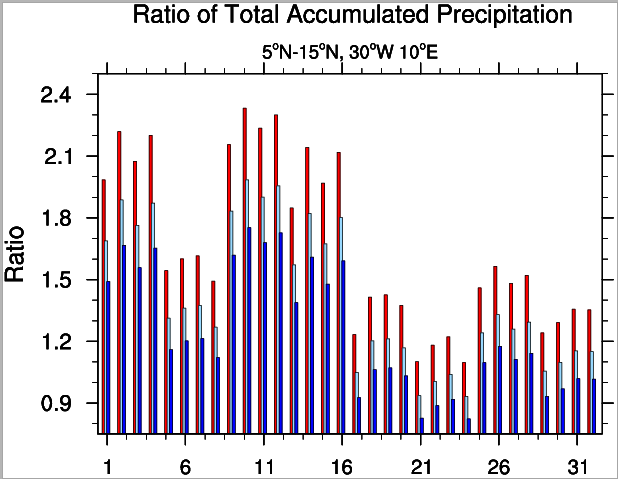
Could I please have some help? I'm plotting 32 points and I just want
the x-axis to say 1 through 32 and have the labels say 1 through 32
I have tried all three of the @tmXBMode options. Is there a way to do
this without using the explicit option?
Below is my snippit of plotting code and I used the "bar_9.ncl"
example as the structure
http://www.ncl.ucar.edu/Applications/bar.shtml
The picture also shows that my tickmarks are off.
Any help would be appreciated.
Sincerely,
Erik
;***********************************************
;Create bar chart
;***********************************************
wks = gsn_open_wks("eps","unique")
newcolor = NhlNewColor(wks,.6,.85,1.)
newcolor = NhlNewColor(wks,0.42,0.42,0.42)
sres = True
sres@vpWidthF = 0.7
sres@vpHeightF = 0.5
sres@vpXF = .15
sres@trXMinF = 0.4
sres@trXMaxF = 32.6
sres@trYMinF = 0.75
sres@trYMaxF = 2.50
sres@gsnDraw = True
sres@gsnFrame = False
sres@gsnXYBarChart = True
sres@gsnXYBarChartBarWidth = 0.20 ; change bar widths
sres@tmXBMode = "Manual"
sres@tmXBTickStartF = 1
sres@tmXBTickEndF = 32
; sres@tmXBTickSpacingF = 1
; sres@tmXBMode = "Explicit" ; explicit labels
; sres@tmXBValues =
(/1,2,3,4,5,6,7,8,9,10,11,12,13,14,15,16,17,18,19,20,21,22,23,24,25,26,27,28,29,30,31,32/)
; sres@tmXBLabels =
(/"E1","E2","E3","E4","E5","E6","E7","E8","E9","E10","E11","E12","E13","E14","E15","E16","E17","E18","E19","E20","E21","E22","E23","E24","E25","E26","E27","E28","E29","E30","E31","E32"/)
sres@tmXBLabelFontHeightF = 0.0205
sres@tmXTLabelFontHeightF = 0.0205
sres@tmYLLabelFontHeightF = 0.0225
sres@tiMainFontHeightF = 0.025
sres@tiMainFont = "helvetica"
sres@tiMainString = " Ratio of Total Accumulated Precipitation"
sres@gsnCenterString = "5~S~o~N~N-15~S~o~N~N, 30~S~o~N~W 10~S~o~N~E"
sres@gsnRightString = ""
sres@tiYAxisString = "Ratio" ;"(~S~o~N~C)"
sres@gsnXYBarChartColors = (/"red"/)
plot1 = gsn_csm_xy(wks,fspan(.775,31.775,32),ratio(:,0),sres) ;
draw each timeseries
sres@gsnXYBarChartColors = (/"lightblue"/)
; seperately, not
plot2 = gsn_csm_xy(wks,fspan(.925,31.925,32),ratio(:,1),sres) ;
advancing the frame
sres@gsnXYBarChartColors = (/"blue"/)
; but tweaking where
plot3 = gsn_csm_xy(wks,fspan(1.075,32.075,32),ratio(:,2),sres) ;
each timeseries is
; drawn on the X-axis
frame(wks)
end
--
_______________________________________________________
Erik Noble
Center for Climate Systems Research, Columbia University
NASA Goddard Institute for Space Studies
2880 Broadway, New York, NY-10025, USA
Tel: +1 (212) 678-5664; Fax: +1 (212) 678-5552
E-mail: enoble@giss.nasa.gov, en2192@columbia.edu
WEB:  http://www.giss.nasa.gov/staff/enoble.html
GISS: http://www.giss.nasa.gov
CCSR: http://www.ccsr.columbia.edu
_______________________________________________________
_______________________________________________
ncl-talk mailing list
List instructions, subscriber options, unsubscribe:
http://mailman.ucar.edu/mailman/listinfo/ncl-talk