Date: Tue May 17 2011 - 11:50:46 MDT
Yes, this should be possible as long as you plot the shapefile data by using gsn_add_polyxxxx, and not just gsn_polyxxx.
Also, you need to make sure that each return value from gsn_add_polyxxxxx is unique.
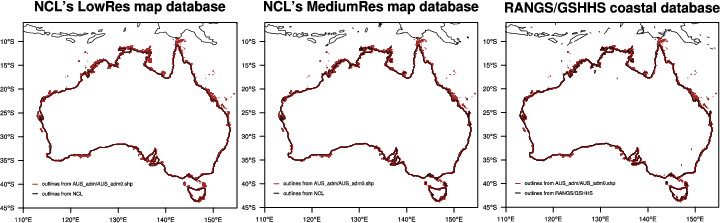
I've attached an example that is basically the "coast_3.ncl" example at http://www.ncl.ucar.edu/Applications/coast.shtml, but with the plots paneled.
Note that the change I had to make was to the "map" variable. I turned it into an array so that I could panel the maps later.
--Mary
On May 17, 2011, at 10:00 AM, jagan TNAU wrote:
> Dear users,
>
> Whether it is possible to use shapefile in panel plots. Is there any example available.
>
> --
> With regards
>
> Dr.R.Jagannathan
> Professor of Agronomy,
> Department of Agronomy
> Tamil Nadu Agricultural University,
> Coimbatore - 641 003 India
>
> PHONE: Mob: +91 94438 89891
>
> DO NOT PRINT THIS E-MAIL UNLESS NECESSARY. THE ENVIRONMENT CONCERNS US ALL.
> _______________________________________________
> ncl-talk mailing list
> List instructions, subscriber options, unsubscribe:
> http://mailman.ucar.edu/mailman/listinfo/ncl-talk
_______________________________________________
ncl-talk mailing list
List instructions, subscriber options, unsubscribe:
http://mailman.ucar.edu/mailman/listinfo/ncl-talk
- application/octet-stream attachment: coast_panel.ncl