These examples show how to use the multi-resolution coastline
database, RANGS (Regionally Accessible Nested Global Shorelines),
developed by Rainer Feistel from Wessel and Smith's GSHHS (Global
Self-consistent Hierarchical High-resolution Shoreline) database
or shapefiles to get better coastal outlines.
To use the RANGS database, you need to download and install it
first. Go to the RANGS
page for more information.
Note: do not use the high-resolution database for global data,
as you will get streaks across your plot. This database is intended
only for regional data.
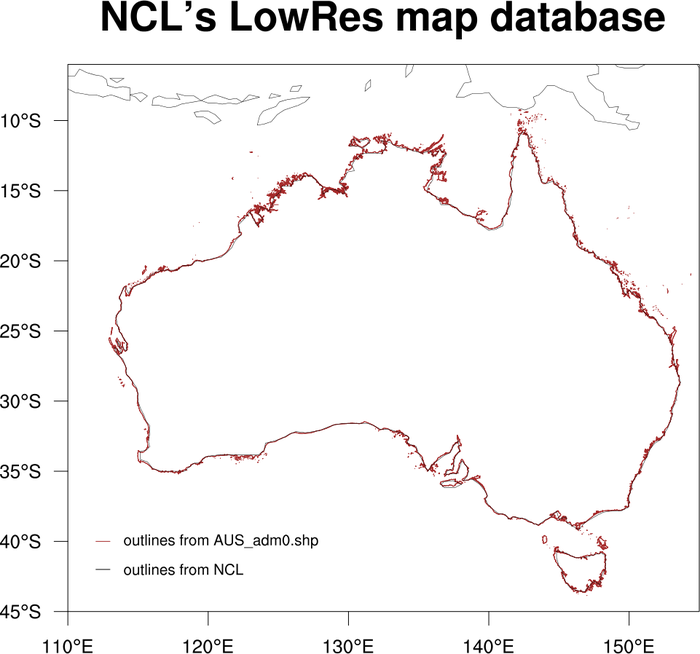
For more information on shapefiles, go to
the shapefiles page.
See the description at the top of the Map
outlines examples page for information about a change to the
behavior of the mpDataBaseVersion
resource in NCL V6.4.0.
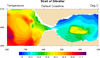
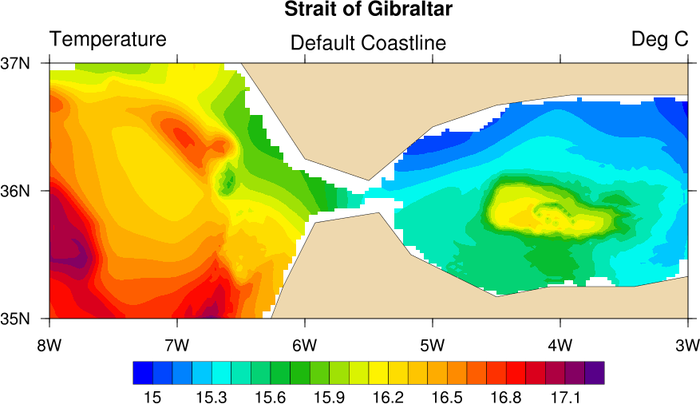
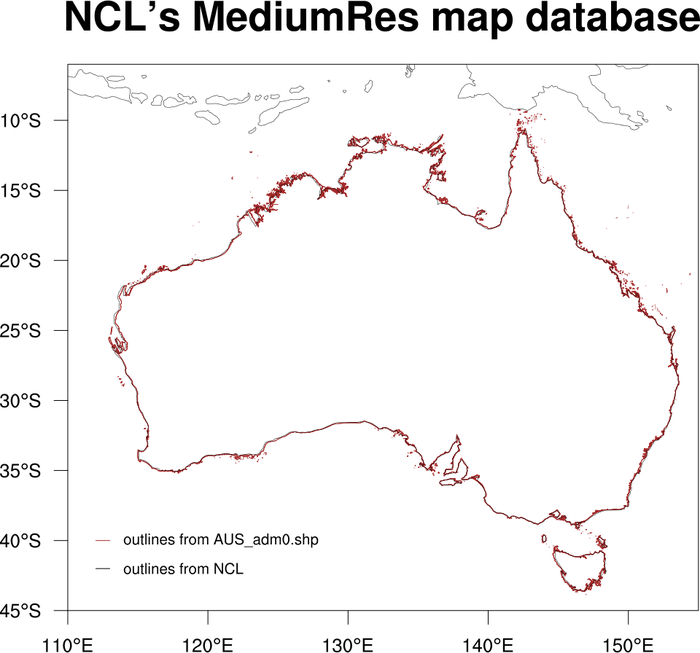
 coast_1.ncl
:
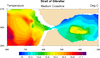
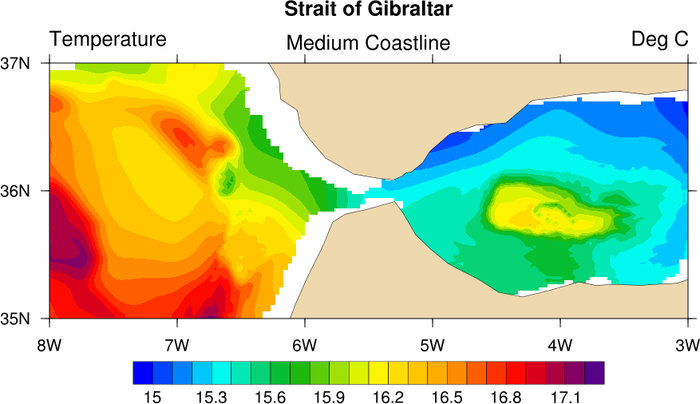
Demonstrates the three levels of coastline data in NCL.
To change the coastline to the medium level, set mpDataBaseVersion = "MediumRes".
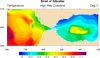
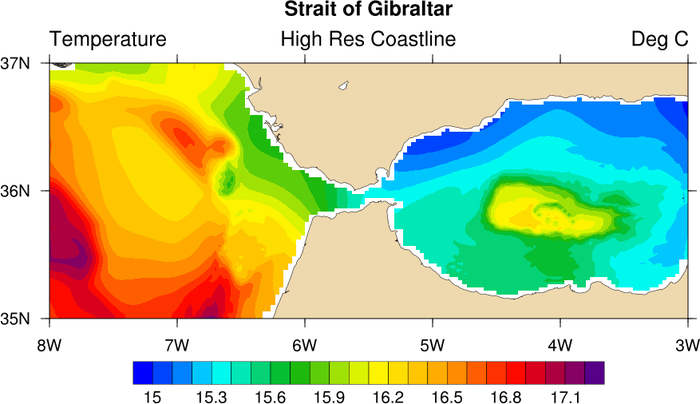
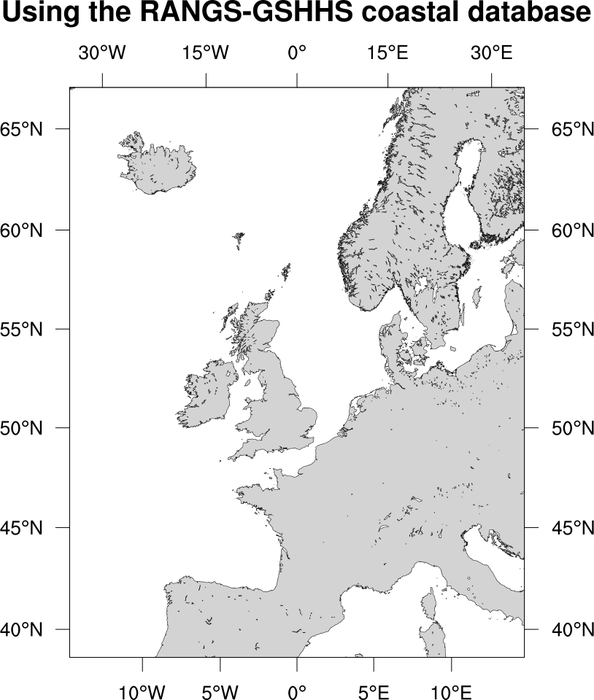
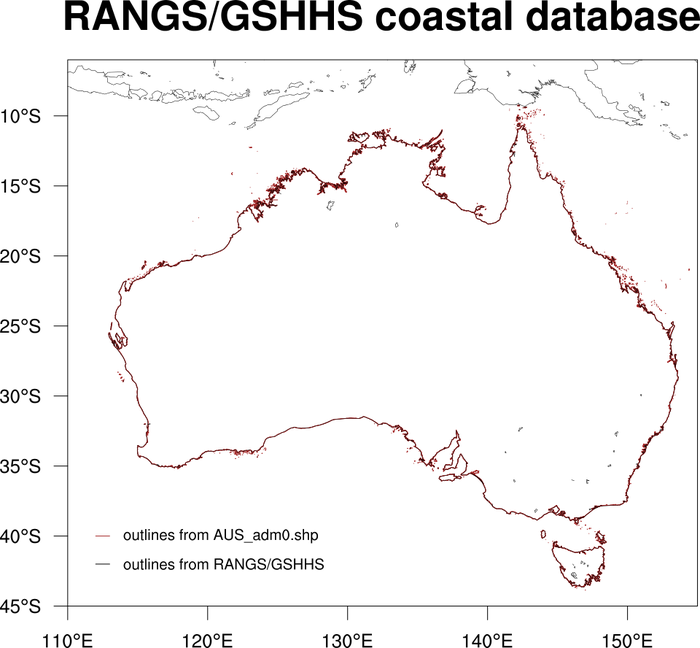
The third example is of the multi-resolution coastline database. Once
you have the RANGS database installed, set mpDataBaseVersion = "HighRes" to create maps
using this database. Note: you should not use this database to plot
maximal area plots, because 1) you will get horizontal lines through
your plot, and 2) it takes a long time.