Date: Wed Sep 21 2011 - 11:59:31 MDT
Dear NCL users,
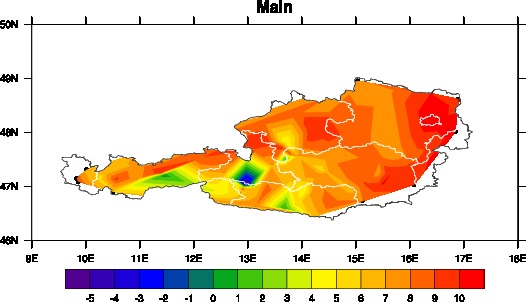
The attached files areĀ NCL script and its plot (I didn't attach data file since it is too big).
My questions are as:
question 1: How to plot the station data by extrapolation so the plot could cover the whole target region?
question 2: The boundary is another shape file, how to change the "boundary line" ( lnres@gsLineThicknessF = 2.0), make it different from the line inside target region.Ā
question 3: I also want to display the mark points, how to bring the mark to the front.
Thanks very much!
Mark
_______________________________________________
ncl-talk mailing list
List instructions, subscriber options, unsubscribe:
http://mailman.ucar.edu/mailman/listinfo/ncl-talk
- application/octet-stream attachment: station_plot.ncl