Hi Ugo,
Your script is complex enough that I would advise that you erase all lb*
resources and start anew. I do this type of thing when NCL is not
behaving as I would expect it would, or if my script has gotten lengthy
enough that debugging is a tad overwhelming.
Starting at the beginning: You are using the rainbow+white+gray
colormap: gsn_define_colormap(wks,"rainbow+white+gray")
http://www.ncl.ucar.edu/Document/Graphics/ColorTables/rainbow+white+gray.shtml
which means you are setting up your colormap with 239 colors. That of
course is fine. Looking at your res1 resource list, I see a few things:
1) You do not need to set res1@gsnMaximize = True, as you are already
doing that when you create map.
2) Setting this: res1@gsnSpreadColors = False does not turn off use of
the entire color map. What this does is tell NCL to not automatically
set cnFillColors with the entire span of the color map.
3) You are creating 101 contour lines (-50:50:1), which means you will
need 102 fill colors. You are only setting 101 fill colors when you set
res1@cnFillColors. This is the main cause of your issue. You must
specify one more color than the number of contour levels.
4) You are setting res1@cnExplicitLabelBarLabelsOn = True. You should
only do this if you wish to overwrite the LabelBar labels by also
setting lbLabelStrings
(http://www.ncl.ucar.edu/Document/Graphics/Resources/lb.shtml#lbLabelStrings).
So you should comment that line out.
5) Do not set res1@lbLabelAlignment = "BoxCenters" unless you want a
label bar to look like this: (middle panel)
http://www.ncl.ucar.edu/Applications/labelbar.shtml#ex14
6) Do not set lbMonoFillColor,lbBoxCount, or lbBoxLinesOn as they are
all not needed in your particular case.
7) Finally, you should not call drawNDCGrid before the plot is created,
as this may nullify the effects of setting gsnMaximize to True. If you
want the grid on there call it after you call draw(map) but before you
call frame(wks).
If you still have questions after reviewing my comments above please let
ncl-talk know. Adam
On 09/28/2011 03:42 PM, ugo merlini wrote:
> Hi
>
> Stiil have problems
>
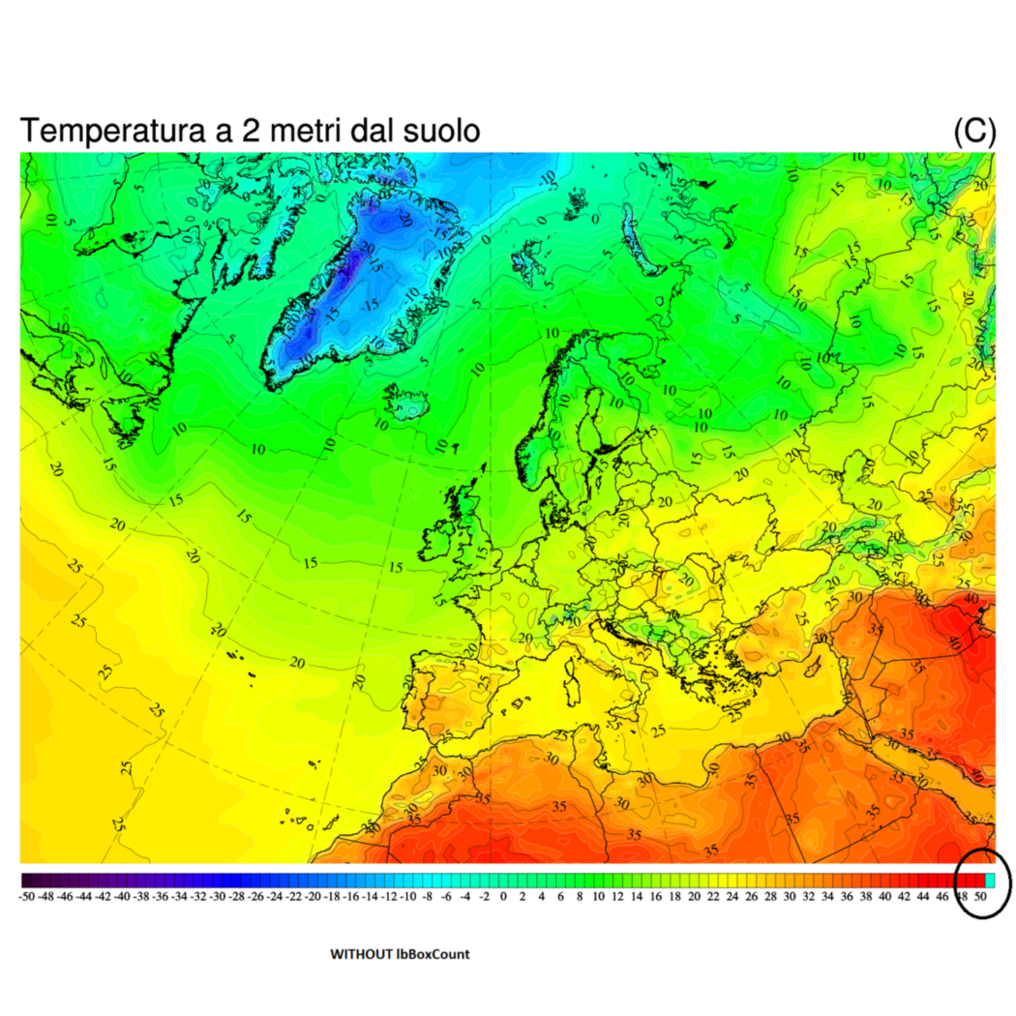
> 1- label bar
> I want do draw 101 labelbar boxes which are the number of colors on the
> map: the only way I have found to solve this is to use lbBoxCount witch
> limit the label box number, but I get warnings on the use of the
> lbBoxCount. If I don't use lbboxcount the laber bar has extra boxies
> colored with srtange colors
>
> http://i103.photobucket.com/albums/m136/ugo73/1.png
>
> http://i103.photobucket.com/albums/m136/ugo73/2.png
>
> 2- I notice that the labelbar text become image after image always more
> bold ?
>
> Ugo
>
>
> ;----------------------------------------------------------------------
> ; This example shows how to read geographic data
> ; from Natural Earth shapefiles
> ; and plot them as polylines and polygons.
> ;----------------------------------------------------------------------
> ; This particular example plots data for Switzerland.
> ;----------------------------------------------------------------------
> ; Download the shapefiles from http://www.naturalearthdata.com/
> ; Unzip to a directory
> ;----------------------------------------------------------------------
>
> load "$NCARG_ROOT/lib/ncarg/nclscripts/csm/gsn_code.ncl"
> load "$NCARG_ROOT/lib/ncarg/nclscripts/csm/gsn_csm.ncl"
> load "$NCARG_ROOT/lib/ncarg/nclscripts/csm/contributed.ncl"
> load "$NCARG_ROOT/lib/ncarg/nclscripts/csm/shea_util.ncl"
>
> begin
>
> ;*****************************************
> ; Open workstation and define colormap *
> ;*****************************************
>
> wks_type = "png" ; use "newpdf" instead of "pdf" for smaller files
> wks_type@wkWidth = 1600
> wks_type@wkHeight = 1600
> wks = gsn_open_wks(wks_type,"temp")
> gsn_define_colormap(wks,"rainbow+white+gray") ; choose colormap
>
> ;*****************
> ; Generare map *
> ;*****************
> ;--- resouces for map
> res = True ; plot mods desired
> res@mpProjection = "LambertConformal" ; choose projection
>
> res = True ; plot mods desired
>
> res@gsnMaximize = True
> res@gsnDraw = False ; do not draw the plot
> res@gsnFrame = False ; do not flip the page
>
> res@mpProjection = "LambertConformal" ; choose projection
> res@mpLimitMode = "LatLon"
> res@mpMaxLonF = 47.0
> res@mpMaxLatF = 88.5
> res@mpMinLatF = 27.0
> res@mpMinLonF = -43.0
> res@mpGridAndLimbOn = True ; turn on grid lines
> res@mpGridLineDashPattern = 10 ; lat/lon lines dashed
>
>
> drawNDCGrid(wks)
>
> map = gsn_csm_map(wks,res)
>
> ;--- create map from shapefiles
>
> fnames = "/mnt/internetserver/map/shapefile/europa/aaa_full/" +
> (/"europa"/) + ".shp" ; Files to be open
> linecolors = (/"Black"/) ; color definition for each shapefile
> fillcolors = (/"Transparent"/) ; Fill color definition for each shapefile
> thicks = (/2/) ; Thickness for each shapefile
> lnres = True ; resources for polylines
> plres = True
> prims = True
> lines = True
> do n=0,dimsizes(fnames)-1 ; Loop through files that we want to read
> geographic information from.
> f = addfile(fnames(n),"r") ; Open the shapefile number n.
> segments = f->segments ; Read data off the shapefile
> geometry = f->geometry
> segsDims = dimsizes(segments)
> geomDims = dimsizes(geometry)
> geom_segIndex = f@geom_segIndex ; Read global attributes
> geom_numSegs = f@geom_numSegs
> segs_xyzIndex = f@segs_xyzIndex
> segs_numPnts = f@segs_numPnts
> geometry_type = f@geometry_type
> numFeatures = geomDims(0)
> lon = f->x
> lat = f->y
> if (geometry_type.eq."polygon") then ; Put if statement outside the loop
> plres@gsFillColor = fillcolors(n)
> plres@gsEdgesOn = True ; Draw border around polygons
> plres@gsEdgeColor = linecolors(n)
> plres@gsEdgeThicknessF = thicks(n)
> do i=0, numFeatures-1 ; Section to draw polygons on map.
> startSegment = geometry(i, geom_segIndex)
> numSegments = geometry(i, geom_numSegs)
> do seg=startSegment, startSegment+numSegments-1
> startPT = segments(seg, segs_xyzIndex)
> endPT = startPT + segments(seg, segs_numPnts) - 1
> dumstr = unique_string("lines") ; This call adds the polygon.
> map@$dumstr$ = gsn_add_polygon(wks, map , lon(startPT:endPT),
> lat(startPT:endPT), plres)
> end do
> end do
> else
> lnres@gsLineThicknessF = thicks(n)
> lnres@gsLineColor = linecolors(n)
> do i=0, numFeatures-1 ; Section to draw polylines on map.
> startSegment = geometry(i, geom_segIndex)
> numSegments = geometry(i, geom_numSegs)
> do seg=startSegment, startSegment+numSegments-1
> startPT = segments(seg, segs_xyzIndex)
> endPT = startPT + segments(seg, segs_numPnts) - 1
> dumstr = unique_string("primitive") ; This call adds the line segment.
> map@$dumstr$ = gsn_add_polyline(wks, map, lon(startPT:endPT),
> lat(startPT:endPT), lnres)
> end do
> end do
> end if
> delete(lat) ; Clean up before we read in same variables again.
> delete(lon)
> delete(segments)
> delete(geometry)
> delete(segsDims)
> delete(geomDims)
> end do
>
> ;******************
> ; read gfs data *
> ;******************
>
> url = "http://nomad1.ncep.noaa.gov:9090/dods/gfs_master/gfs" +
> systemfunc("date +%Y%m%d") + "/"
> systemdate = systemfunc("date +%H")
>
> if ((systemdate.ge.06).and.(systemdate.lt.12)) then
> filename = url + "gfs_master_00z"
> end if
> if ((systemdate.ge.12).and.(systemdate.lt.18)) then
> filename = url + "gfs_master_06z"
> end if
> if ((systemdate.ge.18).and.(systemdate.lt.24)) then
> filename = url + "gfs_master_06z"
> end if
> if ((systemdate.ge.06).and.(systemdate.lt.06)) then
> filename = url + "gfs_master_18z"
> end if
> filename =
> "http://nomad1.ncep.noaa.gov:9090/dods/gfs_master/gfs20110927/gfs_master_06z"
> exists = isfilepresent(filename)
> if(.not.exists) then
> print("OPeNDAP isfilepresent test unsuccessful.")
> print("Either file doesn't exist, or NCL does not have OPeNDAP
> capabilities on this system")
> else
> print("OPeNDAP isfilepresent test successful.")
> gfs = addfile(filename,"r")
> vars = getfilevarnames(gfs)
> end if
>
> ;*******************************
> ; 2 metres temperature plot *
> ;*******************************
> ;--- resouces for 2 metres temperature plot
> res1= True
>
> res1@gsnMaximize = True
> res1@gsnDraw = False ; do not draw the plot
> res1@gsnFrame = False ; do not flip the page
> res1@gsnAddCyclic = True
> res1@gsnSpreadColors = False ; turn off the use entire color map
> res1@gsnContourNegLineDashPattern = 10
>
>
>
>
>
>
> res1@cnLineDashSegLenF = 0.04
>
> res1@cnLinesOn = True ; turn on contour lines
> res1@cnLineLabelsOn = True ; turn on contour labels
> res1@cnLineLabelFont = "times-roman" ; set font on contour labels
> res1@cnLineLabelFontHeightF = 0.006 ; set font height on contour labels
> res1@cnLineLabelPlacementMode = "Constant" ; set placement mode of
> labels on contour
> res1@cnLineLabelBackgroundColor = "Transparent" ; set background color
> of the contour label
>
> res1@cnLevelSelectionMode = "ManualLevels" ; set how manage contour line
> levels
> res1@cnMinLevelValF = -50 ; max level do draw contour lines
> res1@cnMaxLevelValF = 50 ; min level do draw contour lines
> res1@cnLevelSpacingF = 1 ; set spacing between contour lines
> res1@cnLevelFlags =
> (/"LineAndLabel","LineOnly","LineOnly","LineOnly","LineOnly","LineAndLabel","LineOnly","LineOnly","LineOnly","LineOnly",
> \
> "LineAndLabel","LineOnly","LineOnly","LineOnly","LineOnly","LineAndLabel","LineOnly","LineOnly","LineOnly","LineOnly",
> \
> "LineAndLabel","LineOnly","LineOnly","LineOnly","LineOnly","LineAndLabel","LineOnly","LineOnly","LineOnly","LineOnly",
> \
> "LineAndLabel","LineOnly","LineOnly","LineOnly","LineOnly","LineAndLabel","LineOnly","LineOnly","LineOnly","LineOnly",
> \
> "LineAndLabel","LineOnly","LineOnly","LineOnly","LineOnly","LineAndLabel","LineOnly","LineOnly","LineOnly","LineOnly",
> \
> "LineAndLabel","LineOnly","LineOnly","LineOnly","LineOnly","LineAndLabel","LineOnly","LineOnly","LineOnly","LineOnly",
> \
> "LineAndLabel","LineOnly","LineOnly","LineOnly","LineOnly","LineAndLabel","LineOnly","LineOnly","LineOnly","LineOnly",
> \
> "LineAndLabel","LineOnly","LineOnly","LineOnly","LineOnly","LineAndLabel","LineOnly","LineOnly","LineOnly","LineOnly",
> \
> "LineAndLabel","LineOnly","LineOnly","LineOnly","LineOnly","LineAndLabel","LineOnly","LineOnly","LineOnly","LineOnly",
> \
> "LineAndLabel","LineOnly","LineOnly","LineOnly","LineOnly","LineAndLabel","LineOnly","LineOnly","LineOnly","LineOnly",
> \
> "LineAndLabel"/) ; set how draw contour lines
> res1@cnFillColors =
> (/12,14,16,18,20,22,24,26,28,30,32,34,36,38,40,42,44,46,48,50,52,54,56,58,60,62,64,66,68,70,72,74,76,78,80,82,84,86,88,90,92,94,96,98,100,102,104,106,108,110,112,114,116,118,120,122,124,128,132,136,140,144,148,152,156,160,164,166,168,170,172,174,176,178,180,182,184,186,188,190,192,194,196,198,200,202,204,206,208,210,212,214,216,218,220,222,224,226,228,230,232/)
> res1@cnMonoLineColor = False ; turn off auto contour line colors
> res1@cnLineColors =
> (/"Black","White","White","White","White","Black","White","White","White","White",
> \
> "Black","White","White","White","White","Black","White","White","White","White",
> \
> "Black","White","White","White","White","Black","White","White","White","White",
> \
> "Black","White","White","White","White","Black","White","White","White","White",
> \
> "Black","White","White","White","White","Black","White","White","White","White",
> \
> "Black","White","White","White","White","Black","White","White","White","White",
> \
> "Black","White","White","White","White","Black","White","White","White","White",
> \
> "Black","White","White","White","White","Black","White","White","White","White",
> \
> "Black","White","White","White","White","Black","White","White","White","White",
> \
> "Black","White","White","white","White","Black","White","White","White","White",
> \
> "Black"/) ; set contour lines colors
> res1@cnMonoLineThickness = False ; turn off auto contour line thickness
> res1@cnLineThicknesses = (/1.0,0.5,0.5,0.5,0.5,1.0,0.5,0.5,0.5,0.5, \
> 1.0,0.5,0.5,0.5,0.5,1.0,0.5,0.5,0.5,0.5, \
> 1.0,0.5,0.5,0.5,0.5,1.0,0.5,0.5,0.5,0.5, \
> 1.0,0.5,0.5,0.5,0.5,1.0,0.5,0.5,0.5,0.5, \
> 1.0,0.5,0.5,0.5,0.5,1.0,0.5,0.5,0.5,0.5, \
> 1.0,0.5,0.5,0.5,0.5,1.0,0.5,0.5,0.5,0.5, \
> 1.0,0.5,0.5,0.5,0.5,1.0,0.5,0.5,0.5,0.5, \
> 1.0,0.5,0.5,0.5,0.5,1.0,0.5,0.5,0.5,0.5, \
> 1.0,0.5,0.5,0.5,0.5,1.0,0.5,0.5,0.5,0.5, \
> 1.0,0.5,0.5,0.5,0.5,1.0,0.5,0.5,0.5,0.5, \
> 1.0/) ; set contour lines thickness
>
>
>
> ; Create a labelbar object.
>
>
>
>
>
>
>
>
>
>
>
> res1@cnExplicitLabelBarLabelsOn = True
>
>
> res1@lbLabelsOn = True ; turn on the labels
> res1@lbLabelAutoStride = True ; let NCL determine label spacing
> res1@lbLeftMarginF = 0.001
> res1@lbOrientation = "horizontal" ; label orientation
> res1@lbBoxLinesOn = True ; turn on lines between labelbar colors
> res1@lbLabelFont= "times-roman" ; font
> res1@lbLabelFontHeightF= 0.005 ; set the label size
> res1@lbLabelAlignment = "BoxCenters"
> res1@pmLabelBarHeightF = 0.04
> res1@lbLabelStride = 5 ; label every other box
> res1@lbMonoFillColor = False
> res1@lbBoxCount = 101
> res1@lbBoxLinesOn = True
> res1@lbFillColors =
> (/12,14,16,18,20,22,24,26,28,30,32,34,36,38,40,42,44,46,48,50,52,54,56,58,60,62,64,66,68,70,72,74,76,78,80,82,84,86,88,90,92,94,96,98,100,102,104,106,108,110,112,114,116,118,120,122,124,128,132,136,140,144,148,152,156,160,164,166,168,170,172,174,176,178,180,182,184,186,188,190,192,194,196,198,200,202,204,206,208,210,212,214,216,218,220,222,224,226,228,230,232/)
> res1@lbMonoFillPattern = True
>
>
>
>
>
> res1@cnFillOn = True ; turn on color
>
>
>
>
>
>
> ;---data for 2 metres temperature plot
>
> TEMP2M = gfs->tmp2m(:,:,:) ; temperature
> NTIMES = dimsizes(gfs->time) ; number of times in the file
> TEMP2M = TEMP2M - 273.15
> TEMP2M@units = "(C)"
> TEMP2M@long_name = "Temperatura a 2 metri dal suolo"
> do it = 0,10 ;NTIMES-1
> plot = gsn_csm_contour(wks,TEMP2M(it,:,:),res1)
> overlay(map,plot)
> draw(map)
> frame(wks)
> end do
> do it = 0,10 ;NTIMES-1
> if (it.le.8) then
> system("mv temp.00000" + (it+1) + ".png" + " temperatura0" + (it) + "_"
> + systemfunc("date +%Y%m%d%H") + ".png")
> end if
> if (it.eq.9) then
> system("mv temp.0000" + (it+1) + ".png" + " temperatura0" + (it) + "_" +
> systemfunc("date +%Y%m%d%H") + ".png")
> end if
> if (it.ge.10) then
> system("mv temp.0000" + (it+1) + ".png" + " temperatura" + (it) + "_" +
> systemfunc("date +%Y%m%d%H") + ".png")
> end if
> end do
> end
>
>
>
>
> _______________________________________________
> ncl-talk mailing list
> List instructions, subscriber options, unsubscribe:
> http://mailman.ucar.edu/mailman/listinfo/ncl-talk
--
______________________________________________________________
Adam Phillips                                asphilli@ucar.edu
NCAR/Climate and Global Dynamics Division       (303) 497-1726
P.O. Box 3000
Boulder, CO 80307-3000    http://www.cgd.ucar.edu/cas/asphilli
_______________________________________________
ncl-talk mailing list
List instructions, subscriber options, unsubscribe:
http://mailman.ucar.edu/mailman/listinfo/ncl-talk
Received on Wed Sep 28 16:48:18 2011
This archive was generated by hypermail 2.1.8 : Sun Oct 09 2011 - 13:05:26 MDT