Date: Mon Jan 14 2013 - 17:41:00 MST
No problem, the function gsn_add_polymarker is probably what you want. It
overlays any number of dots onto a base plot, and it uses lat/lon
coordinate pairs to position the dots. Here is a nice example on a global
map:
http://www.ncl.ucar.edu/Applications/Images/minmax_4_lg.png
This and many similar map examples are listed here:
http://www.ncl.ucar.edu/Applications/func_list.shtml#gsn_add_polymarker
--Dave
On Mon, Jan 14, 2013 at 4:50 PM, Capehart, William J <
William.Capehart@sdsmt.edu> wrote:
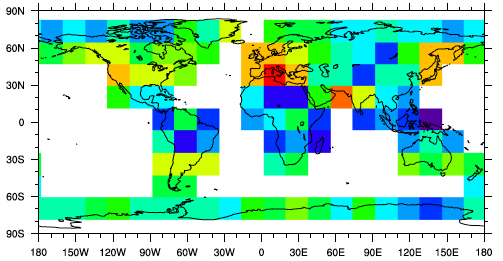
> We have a challenge here. We are working with global data subsets and
> would like to be able to do an "overview" of scatter distributions
> globally. Ideally we'd like to take the plot scene, such as the one in
> this email, and overlay tiny scatterplots (no axes or labels, just the
> scatter dots) over the individual subsets (shown by the color chips).
> Does NCL have the capacity to do this in any capacity?
>
>
> Thankymuch!
>
>
_______________________________________________
ncl-talk mailing list
List instructions, subscriber options, unsubscribe:
http://mailman.ucar.edu/mailman/listinfo/ncl-talk