Date: Mon Jan 14 2013 - 16:50:43 MST
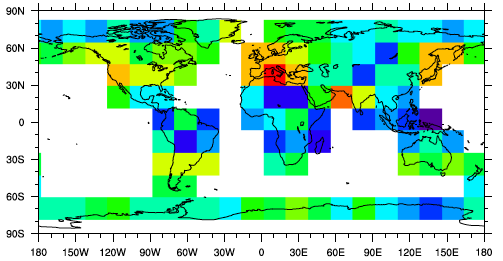
We have a challenge here. We are working with global data subsets and would like to be able to do an "overview" of scatter distributions globally. Ideally we'd like to take the plot scene, such as the one in this email, and overlay tiny scatterplots (no axes or labels, just the scatter dots) over the individual subsets (shown by the color chips). Does NCL have the capacity to do this in any capacity?
[cid:B8A2FC6D-6CD2-4779-AEC5-34B638F8AE3B]
Thankymuch!
================================================================
Bill Capehart <William.Capehart@sdsmt.edu> Associate Professor
Department of Atmospheric Sciences AES PhD Coordinator
213 Mineral Industries Building Skype/EVO: wcapehart
South Dakota School of Mines and Technology Ph: +1-605-394-1994
501 East Saint Joseph Street Fax: +1-605-394-6061
Rapid City, SD 57701-3995 Mobile: +1-605-484-5692
=================== http://capehart.sdsmt.edu ==================
_______________________________________________
ncl-talk mailing list
List instructions, subscriber options, unsubscribe:
http://mailman.ucar.edu/mailman/listinfo/ncl-talk