Date: Thu Feb 21 2013 - 02:27:27 MST
Hello there,
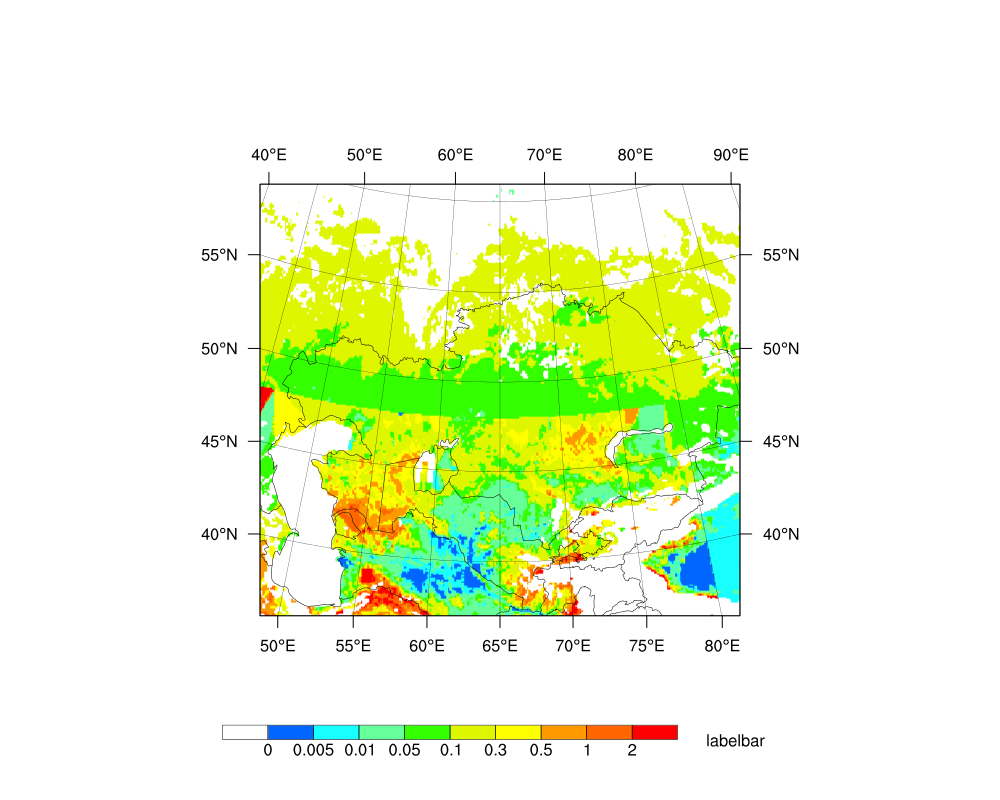
I have a data field from WRF model in Lambertconformal project, shown in
a.png. I simply used WRF_map_c(wrf_file,res,0) to set up mp resources.
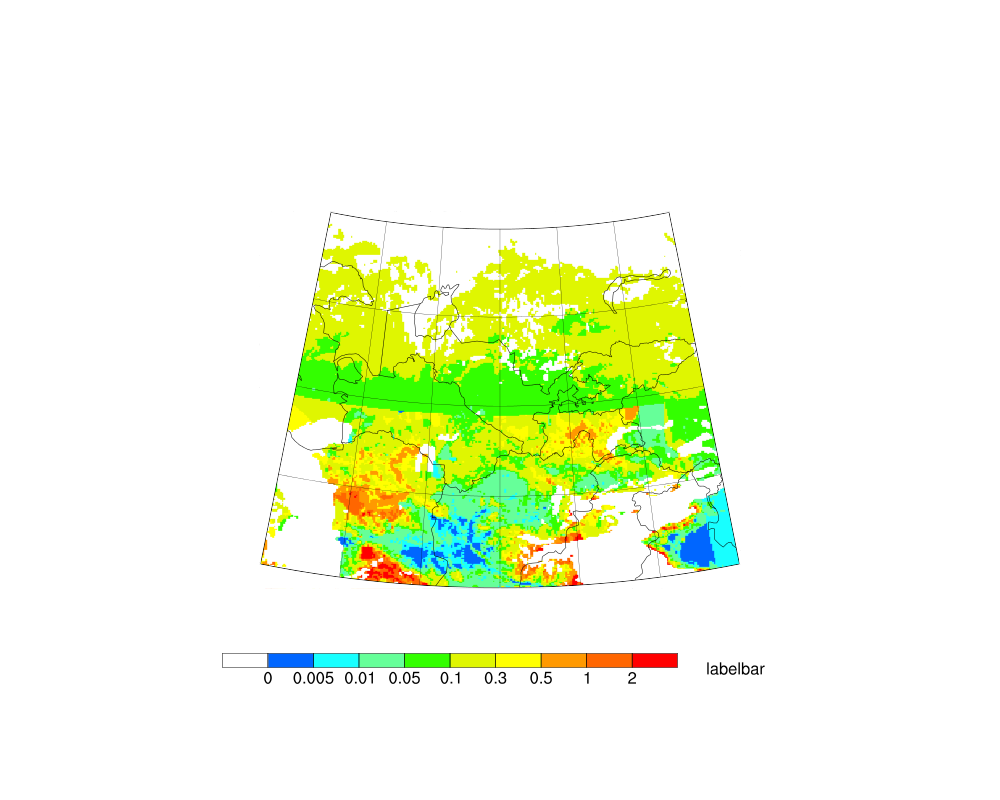
Now I want to make a plot of only a part of the domain, 50E-80E, far south
of domain-50N, I used the following setup; the data field b.png comes
mismatched with the map outline. Can someone help on this?
res@mpProjection = "LambertConformal"
res@mpLimitMode = "LatLon"
res@mpMinLatF=30.0
res@mpMaxLatF=50.0
res@mpMinLonF=50.0
res@mpMaxLonF=80.0
res@mpCenterLonF = wrf_file@CEN_LON
res@mpLambertParallel1F = wrf_file@TRUELAT1
res@mpLambertParallel2F = wrf_file@TRUELAT2
res@mpLambertMeridianF = wrf_file@CEN_LON
res@gsnMaskLambertConformal = True
Thanks,
Xin
_______________________________________________
ncl-talk mailing list
List instructions, subscriber options, unsubscribe:
http://mailman.ucar.edu/mailman/listinfo/ncl-talk