Date: Fri Feb 22 2013 - 09:48:33 MST
Hi Mohammad,
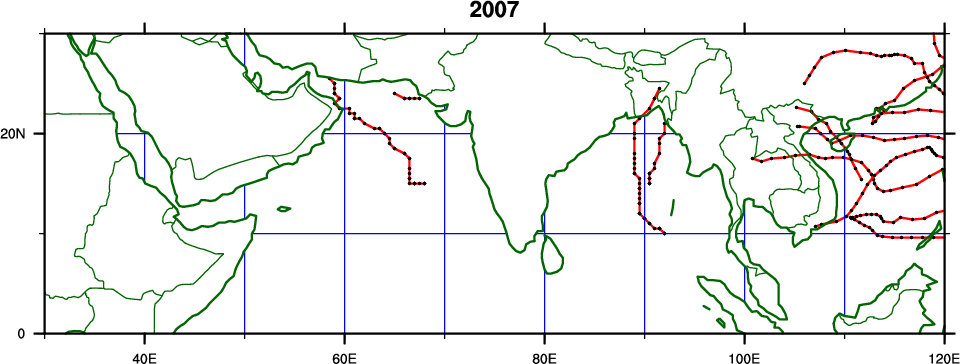
Attached is a sample script that plots the tracks for 1 year. You should be
able to edit it to plot other years or do some of the other tasks you want
to do.
A few notes on IBTrACS...
- In my script, I use the wmo subset, which is much easier to work with as
there is only one track for each storm. The version you were using has
tracks from all available data sources.
http://www.ncdc.noaa.gov/oa/ibtracs/index.php?name=wmo-data
- For the NIO, the WMO data only go back to 1990. The ibtracs_all has JTWC
and other archival sources that go back much further, but their quality may
be more questionable.
- You should be able to trim the tracks for the winds using the wind_wmo
variable.
- If you want to pick an individual storm, search for it in the file using
the "storm_sn" variable. The serial number for the storm you're looking for
can be found by browsing this page:
http://storm5.atms.unca.edu/browse-ibtracs/browseIbtracs.php?name=browse-location
http://storm5.atms.unca.edu/browse-ibtracs/browseIbtracs.php?name=v03r02-2007314N10093
Hope this helps...
Carl
On Tue, Feb 19, 2013 at 9:45 PM, mdw4 <Md.Wahiduzzaman@utas.edu.au> wrote:
>
>
> Hello
>
>
> This is Mohammed. I'm a new user of NCL. I'll use NCL for my thesis. I
> would like to draw the cyclonic storm genesis point and their track over
> North Indian Ocean. I've used netcdf file. I can draw the genesis point
> (find the attached ps)but still don't know how to add the time as the data
> range from ibtracts is 1842-2011. I have attached few scripts and data for
> your consideration.
>
>
> My query:
> 1. How can I add the time range for example 1961-2011 and If I would like
> to ignore the data whose wind speed is less than 34 knots then how can i
> add ??
> 2. If I plot one year data then it shows the number of cyclone genesis
> points but how can i draw the points of each cyclone respect to day and
> hours basis for example genesis point of SIDR in 2007 from the data set?
> 3. How can I plot the cyclonic tracks over NIO and also for example one
> year like 1991 or specifically SIDR in 2007??
>
>
>
> I look foreword to hearing from you at your earliest opportunity.
>
>
> Cheers
> -Mohammad
>
>
>
>
>
>
> _______________________________________________
> ncl-talk mailing list
> List instructions, subscriber options, unsubscribe:
> http://mailman.ucar.edu/mailman/listinfo/ncl-talk
>
>
--
Carl J. Schreck III, PhD
Cooperative Institute for Climate and Satellites (CICS-NC)
North Carolina State University   |   NOAA's National Climatic Data Center
Email: carl@cicsnc.org   |   Tel: 828-257-3140
http://www.cyclonecenter.org/   |   http://monitor.cicsnc.org/mjo/
_______________________________________________
ncl-talk mailing list
List instructions, subscriber options, unsubscribe:
http://mailman.ucar.edu/mailman/listinfo/ncl-talk
- application/octet-stream attachment: track_map.ncl