Date: Mon Feb 25 2013 - 18:15:07 MST
Hi All,
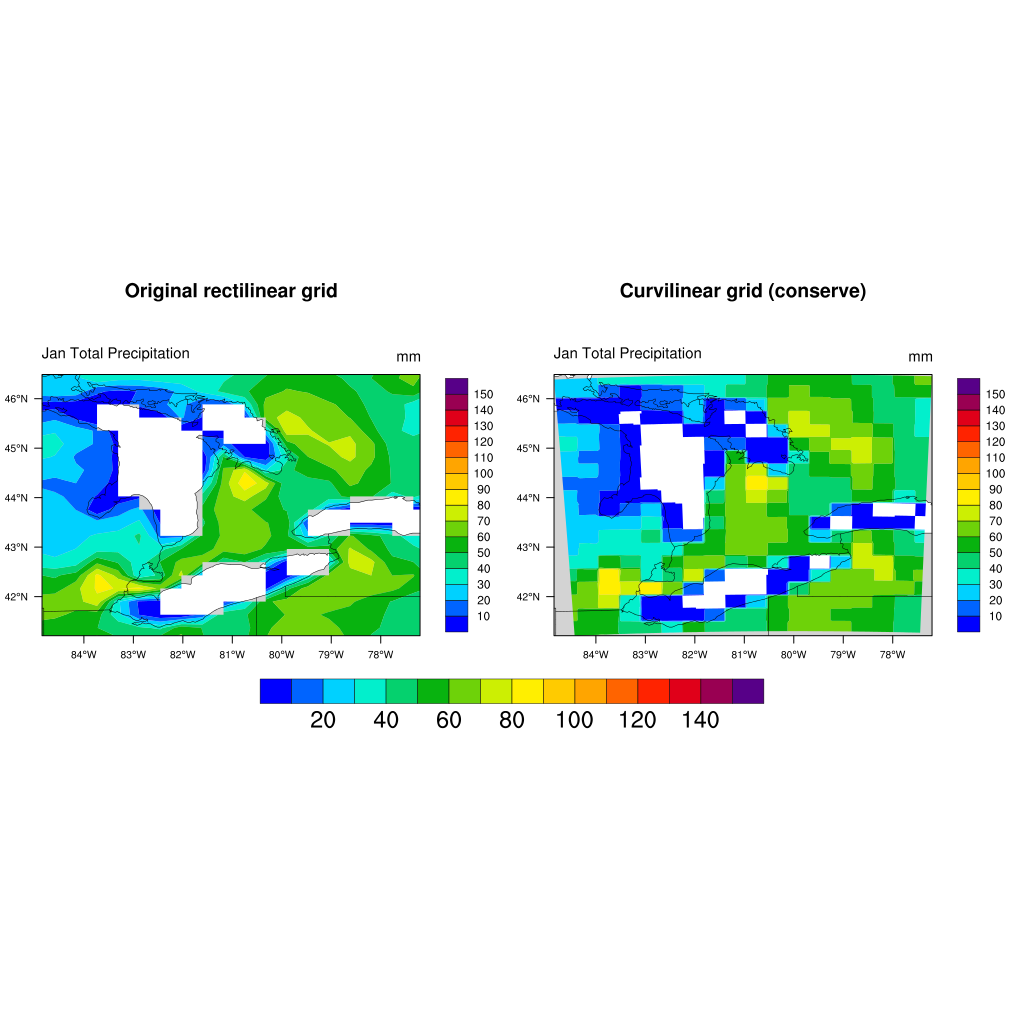
I have generated the following plot using
http://www.ncl.ucar.edu/Applications/Templates/ESMF_rect_to_curv.ncl
script but a bit confused about the simulation pattern. Could you
please tell me whether I should be expecting a figure of this type or
not? I look forward to hearing from you. Please see the attached figure:
Thanks
Palash
Here you go the code I have used:
===========================================
;---------------------------------------------------------------------
load "$NCARG_ROOT/lib/ncarg/nclscripts/csm/gsn_code.ncl"
load "$NCARG_ROOT/lib/ncarg/nclscripts/csm/gsn_csm.ncl"
load "$NCARG_ROOT/lib/ncarg/nclscripts/csm/contributed.ncl"
load "$NCARG_ROOT/lib/ncarg/nclscripts/wrf/WRFUserARW.ncl"
load "$NCARG_ROOT/lib/ncarg/nclscripts/esmf/ESMF_regridding.ncl"
begin
;--Data file containing source grid
src_file = "prcp_jan_day_cu_sum.nc" ;;---Change (likely)
sfile = addfile(src_file,"r")
src_lat = sfile->lat ;;---Change (likely)
src_lon = sfile->lon ;;---Change (likely)
;---Get variable to regrid
varname = "prcp" ;;---Change (likely)
var = sfile->$varname$ ; Assumption is that "var"
; contains coordinate arrays.
printVarSummary(var) ; Make sure it has coord arrays.
;---Data file containing destination grid
dst_file = "wrfout_d02_2002-01-01.nc"
;;---Change (likely)
dfile = addfile(dst_file,"r")
dst_lat = dfile->XLAT(0,:,:) ;;---Change (likely)
dst_lon = dfile->XLONG(0,:,:) ;;---Change (likely)
;---Set up regridding options
Opt = True
;---"bilinear" is the default. "patch" and "conserve" are other options.
method = "conserve"
Opt@InterpMethod = method ;;---Change (maybe)
Opt@WgtFileName = "rect_to_curv.nc"
;
; These next two lines only needed if "var" doesn't
; contain coordinate arrays.
;
Opt@SrcGridLat = sfile->lat ;;--Change (maybe)
Opt@SrcGridLon = sfile->lon ;;--Change (maybe)
Opt@SrcRegional = True ;;--Change (maybe)
Opt@SrcInputFileName = src_file ; optional, but good idea
Opt@DstGridLat = dst_lat ; destination grid
Opt@DstGridLon = dst_lon
Opt@DstRegional = True ;;--Change (maybe)
Opt@CopyVarCoords = True ; Needed in V6.1.0-beta
(not in V6.1.0)
Opt@ForceOverwrite = True
Opt@PrintTimings = True
Opt@Debug = True
var_regrid = ESMF_regrid(var,Opt) ; Do the regridding
printVarSummary(var_regrid) ; Check that everything
printMinMax(var_regrid,0) ; looks okay.
;---Info needed if 'netCDF' and/or 'PLOT' is True
dimv = dimsizes(var)
ntim = dimv(0)
nlat = dimv(1)
mlon = dimv(2)
dimvr = dimsizes(var_regrid)
NLAT = dimvr(1)
MLON = dimvr(2)
delete(var_regrid@grid_mapping) ; not for regridded variable
;----------------------------------------------------------------------
; Plotting section
;
; This section creates filled contour plots of both the original
; data and the regridded data, and panels them.
;----------------------------------------------------------------------
wks = gsn_open_wks("png","day_cu_sum_rect_to_curv")
gsn_define_colormap(wks,"BlAqGrYeOrReVi200")
res = True
res@gsnMaximize = True
res@gsnLeftString = "Jan Total Precipitation"
res@gsnAddCyclic = False
; res@gsnDraw = False
; res@gsnFrame = False
res@cnFillOn = True
res@cnLinesOn = False
res@cnLineLabelsOn = False
; res@cnFillMode = "RasterFill"
res@lbLabelBarOn = True ; Turn on later in panel
res@lbOrientation = "Vertical" ; default is horizontal
res@mpFillOn = True
res@mpMinLatF = min(dst_lat)
res@mpMaxLatF = max(dst_lat)
res@mpMinLonF = min(dst_lon)
res@mpMaxLonF = max(dst_lon)
res@mpGridLineDashPattern = 2 ; lat/lon
lines as dashed
;************************************************
; Turn on lat / lon labeling
;************************************************
res@pmTickMarkDisplayMode = "Always" ; turn on tickmarks
res@tmXTOn = False ; turn off top labels
res@tmYROn = False ; turn off right labels
res@mpFillOn = True ; turn off map fill
res@mpOutlineBoundarySets= "GeophysicalAndUSStates" ; state boundaries
res@mpDataBaseVersion = "MediumRes"
res@cnLevelSelectionMode = "ManualLevels"
res@cnMinLevelValF = 10.0
res@cnMaxLevelValF = 150.0
res@cnLevelSpacingF = 10.0
;*************************************************************************************
;---Resources for plotting regridded data
res@gsnAddCyclic = False ;;---Change (maybe)
res@tiMainString = "Curvilinear grid (" + Opt@InterpMethod + ")"
var_regrid@units = "mm"
plot_regrid = gsn_csm_contour_map(wks,var_regrid(30,:,:),res)
; plot = gsn_csm_contour_map(wks,var_regrid(30,:,:),res)
;---Resources for plotting original data
var@lat2d = src_lat
var@lon2d = src_lon
var@units = "mm"
res@gsnAddCyclic = False ;;---Change (maybe)
res@tiMainString = "Original rectilinear grid"
plot_orig = gsn_csm_contour_map(wks,var(30,:,:),res)
;---Compare the plots in a panel
pres = True
pres@gsnMaximize = True
pres@gsnPanelLabelBar = True
gsn_panel(wks,(/plot_orig,plot_regrid/),(/1,2/),pres)
end
_______________________________________________
ncl-talk mailing list
List instructions, subscriber options, unsubscribe:
http://mailman.ucar.edu/mailman/listinfo/ncl-talk