Date: Mon Mar 11 2013 - 06:57:39 MDT
Hi guys,
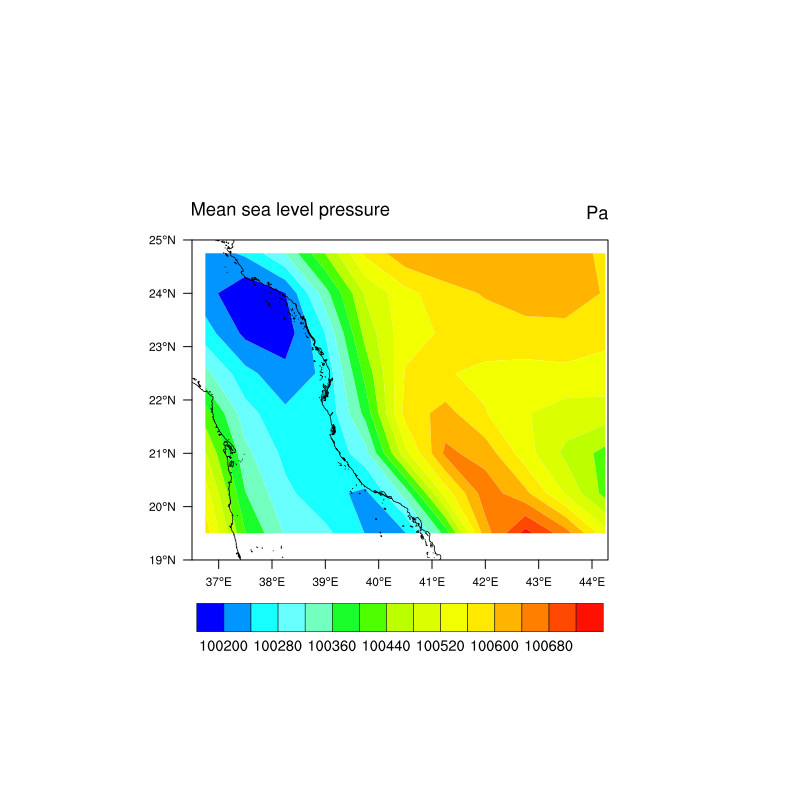
I am trying to plot a simple 2D variable from ECMWF data on selected area. NCL plots the SLP on the map but the background map is larger than the plotted SLP (png image attached) although lat/lon coordinates for map and slp are same. I guess it is because of some projection issue, i tried but could not fix it. I will appreciate if anyone could help me fixing this. The NCL script is copied below:
Thanks and best regards,
Basit
;*************************************************
load "$NCARG_ROOT/lib/ncarg/nclscripts/csm/gsn_code.ncl"
load "$NCARG_ROOT/lib/ncarg/nclscripts/csm/gsn_csm.ncl"
load "$NCARG_ROOT/lib/ncarg/nclscripts/csm/contributed.ncl"
;************************************************
begin
;************************************************
; create pointer to file and read in data
;************************************************
in = addfile("/project/k14/basit/wrf-sims/wrf_166/ei_oper_an_sfc_075x075_20100526_20100719.nc","r")
minLat = 19.0
maxLat = 25.0
minLon = 36.5
maxLon = 44.3
g0_lat_1 = in->g0_lat_1 ; for _SFC
g0_lon_2 = in->g0_lon_2 ; for _SFC
initial_time0_hours = in->initial_time0_hours ;time in julian date format
yymmddhh = cd_calendar(initial_time0_hours,3)
msl = in->MSL_GDS0_SFC
dims_msl = dimsizes(msl)
msl&g0_lat_1 = g0_lat_1
msl&g0_lon_2 = g0_lon_2
do it=136, 136, 1
;************************************************
; create default plot
;************************************************
wks = gsn_open_wks("png","ecmwf_plot") ; open a ps file
gsn_define_colormap(wks,"BlAqGrYeOrRe") ; choose colormap
res = True ; plot mods desired
res@cnFillOn = True ; turn on color fill
res@cnLinesOn = False ; turn off contour lines
res@pmTickMarkDisplayMode = "Always"; use NCL default lat/lon labels
res@gsnAddCyclic = False ; data already has cyclic point
res@mpGeophysicalLineColor = "Black"
res@mpLimbLineColor = "Blue"
res@mpGeophysicalLineThicknessF = 1.5
res@mpDataBaseVersion = "HighRes" ; Use the high-res database
res@mpDataResolution = "FinestResolution"
res@pmTickMarkDisplayMode = "Always" ; Turn on map tickmarks.
res@mpOutlineOn = True
res@mpFillOn = False
res@mpGridLineThicknessF = 0.5
res@mpGridSpacingF = 3
res@mpLimitMode = "LatLon"
res@mpMinLatF = 19. ; range to zoom in on
res@mpMaxLatF = 25.
res@mpMinLonF = 36.5
res@mpMaxLonF = 44.3
res@gsnSpreadColors = True
res@gsnSpreadColorEnd = -3
res@gsnSpreadColors = True ; use full range of color map
plot = gsn_csm_contour_map(wks,msl(it,{19.:25.},{36.5:44.3}),res)
frame(wks)
end do
end
----
Basit A. Khan, Ph.D.
Postdoctoral Research Fellow
Division of Physical Sciences & Engineering
Office# 3204, Level 3, Building 1,
King Abdullah University of Science & Technology
4700 King Abdullah Blvd, Box 2753, Thuwal 23955 –6900,
Kingdom of Saudi Arabia.
Office: +966(0)2 808 0276,  Mobile: +966(0)5 0860 3617
E-mail: basitali.khan@kaust.edu.sa<mailto:basitali.khan@kaust.edu.sa>
Skype name: basit.a.khan
________________________________
This message and its contents including attachments are intended solely for the original recipient. If you are not the intended recipient or have received this message in error, please notify me immediately and delete this message from your computer system. Any unauthorized use or distribution is prohibited. Please consider the environment before printing this email.
_______________________________________________
ncl-talk mailing list
List instructions, subscriber options, unsubscribe:
http://mailman.ucar.edu/mailman/listinfo/ncl-talk