I previously forgot to attach my updated version of shapefile_12.ncl. It
is now attached to this message. Sorry for the confusion.
CL, would you mind giving this version a try for your Georgia area? Thank
you.
--Dave
On Tue, Apr 9, 2013 at 11:48 AM, Luo, Chao <chao.luo@eas.gatech.edu> wrote:
> Hi,
>
> I just test shapefile_12.ncl by only changing highway to I-75, I-85, I-285
> and zoom in GA. It seems the script didn't draw highway inside of GA
> boundary, only draws highway out of GA boundary. I am attaching the test
> plot. Very appreciate your help!
>
> cl
>
> ----- Original Message -----
> From: "Dave Allured - NOAA Affiliate" <dave.allured@noaa.gov>
> To: ncl-talk@ucar.edu
> Sent: Tuesday, April 9, 2013 10:25:40 AM
> Subject: Re: pollutants distribution over traffic map
>
> Hi Mary.
>
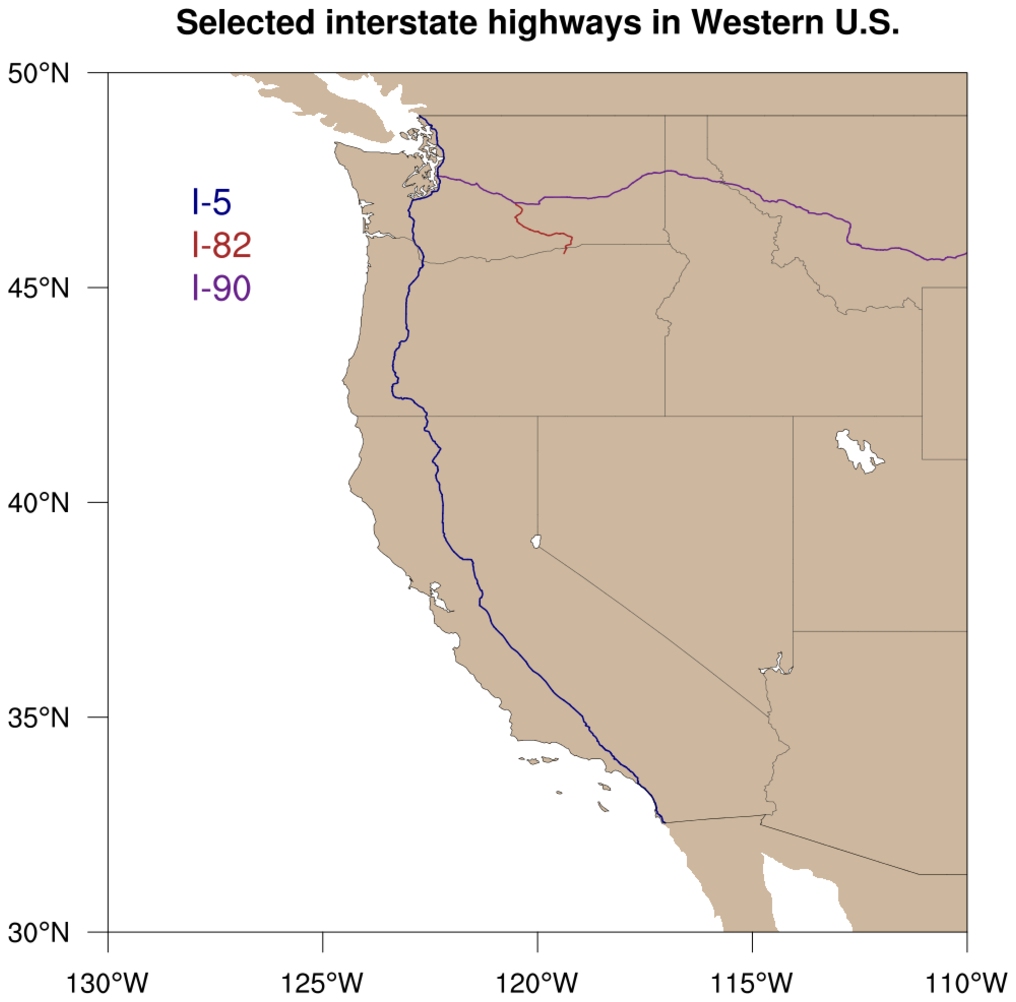
> Your current example shapefile_12 misses some of the requested highway
> segments. Attached is a corrected script. Please consider using this
> version on the example website. Compare your example plot
> here<http://www.ncl.ucar.edu/Applications/Images/shapefiles_12_lg.png>
> to
> the corrected version:
>
> [image: Inline image 1]
>
> The problem is that this particular highway shape file contains some
> complex entries in the feature_names, for example "I- 5, US 30". You need
> to add a little extra string handling code to adapt to these complex name
> strings.
>
> --Dave
>
> On Tue, Apr 9, 2013 at 9:12 AM, Mary Haley <haley@ucar.edu> wrote:
>
> > Hi folks,
> >
> > I updated the example to add a simple text legend. I kept wondering which
> > highway that little brown line was. :-)
> >
> > If you need to query a shapefile string variable in order to determine
> > whether to draw a certain feature (for example to draw only highways that
> > start with "I-"), then you can use the str_match_ind function (see also
> the
> > other str_xxxx functions for more string processing).
> >
> > --Mary
> >
> > On Apr 8, 2013, at 7:57 PM, Jim Means wrote:
> >
> > Mary Haley was kind enough to just create an example that showed how to
> > plot highways using a shapefile from NOAA:
> >
> > http://www.ncl.ucar.edu/Applications/shapefiles.shtml
> >
> > It's the last example on the page, shapefiles_12.ncl. I used code from
> > that example to overlay radar data on a highway map, that sounds somewhat
> > similar to what you're doing.
> >
> > Jim
> >
> > On 4/9/2013 00:55, Luo, Chao wrote:
> >
> > Hi,
> >
> > I am trying to make plot for visualization of local pollutants
> > distribution overlap on main highways, and was wondering if NCL has such
> > function, which can be used to do it.
> >
> > Very appreciate any suggestion and help!
> >
> > cl
>
_______________________________________________
ncl-talk mailing list
List instructions, subscriber options, unsubscribe:
http://mailman.ucar.edu/mailman/listinfo/ncl-talk
This archive was generated by hypermail 2.1.8 : Mon Apr 15 2013 - 20:12:25 MDT