Date: Thu May 09 2013 - 17:49:42 MDT
[1] You *must* put a better "Subject" identifier
[2] See attached
[3] Please respond only to the ncl-talk (No salutations);
[4] Please do not send multiple message. Onlu one post.
[5] Please do not call on the phone.
Thank You
On 05/09/2013 01:43 PM, nand_s wrote:
> Dear Mary,
>
> Thanks for your support online and I really appreciate that a lot.
> Ma’am, Actually the graph you have given me, I had done that before but
> I think my question to you was not very clear. What I wanted to request
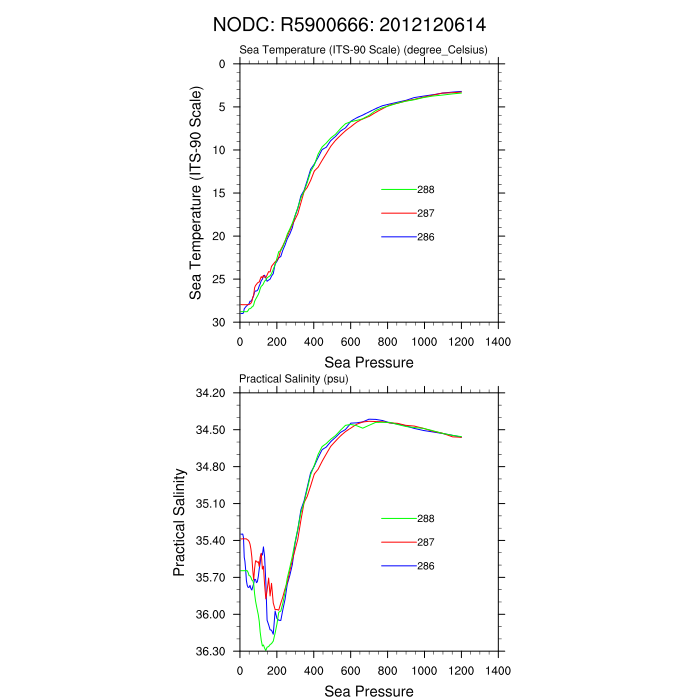
> for is that, one float named as 5900666 has three profiles and all these
> three profiles generates 2 graphs respectively, i.e, TEMPERATURE vs
> PRESSURE and PRACTICAL SALINITY vs PRESSURE , therefore total of 6
> graphs are generated from 3 profiles. So, my interest is into merging
> the 3 TEMPERATURE vs PRESSURE graph in to one XY plot from different
> profiles because I really find it difficult to call netCDF files from
> different profiles and merge the graphs into one plot. For example, all
> TEMPERATURE vs PRESSURE in one plot from all the 3 profiles. Attached
> are the “.nc” files with “nodc.ncl” file and can you please assist me in
> this.
>
> With many thanks.
>
> *Sachin Ravilesh Nand | Software Engineer (Consultant)*
>
> /B.C.A (Bangalore University-India)/
>
> European Union Global Climate Change Alliance Project.
>
> Pacific Centre for Environment and Sustainable Development.
>
> University of the South Pacific.
>
> E: sachin.nand@usp.ac.fj <mailto:sachin.nand@usp.ac.fj>
>
> T: (+679) 32 32205
>
> *From:*Mary Haley [mailto:haley@ucar.edu]
> *Sent:* Thursday, May 09, 2013 3:34 AM
> *To:* nand_s
> *Cc:* ncl-talk@ucar.edu
> *Subject:* Re: [ncl-talk] Request
>
>
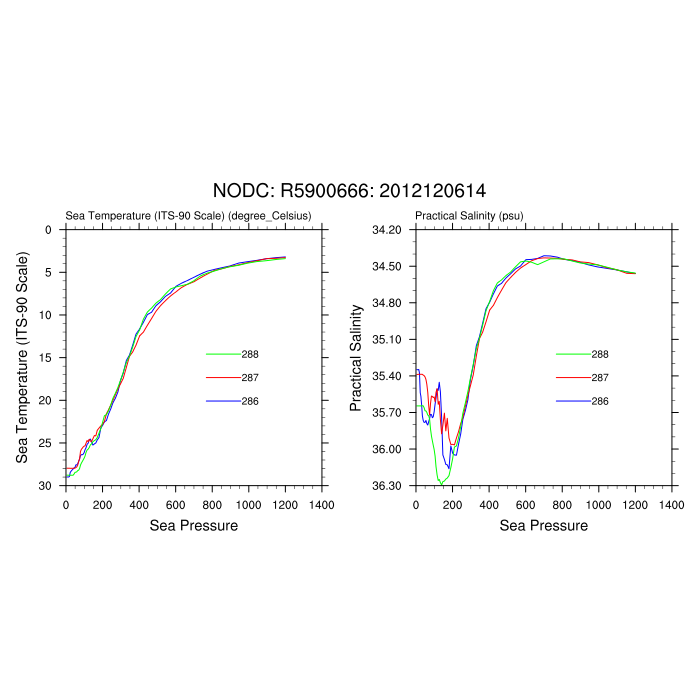
> If I understand your request, you want to put both curves in the same
> plot. To do this, you can use "gsn_csm_x2y". This function assumes
> that you have two curves with different X axes, but the same Y axis
> values. See the attached modification to your code and a PNG.
>
> Please try to understand these scripts that we send you before sending
> more requests for help. We have some tips on where to get help on our
> "tips and posting guidelines" page:
>
> http://www.ncl.ucar.edu/Support/posting_guidelines.shtml
>
> Good luck,
>
> --Mary
>
>
>
> On May 7, 2013, at 4:08 PM, nand_s wrote:
>
>>
>> Hello Recipient,
>>
>> Thank you very much, I really appreciate your assistance. I have gone through each and every response I have got from NCL developers but I was bit confused at some response that's why what ever addition to the code I was given by NCL developers I use to paste it in my original NCL code and run it but still all the time its
> generating some errors. This is the original code and i wanted to
> request for the code which can merge the profiles of a single float. The
> given code generates separate graph's for different profiles.
>> >
>> > load "$NCARG_ROOT/lib/ncarg/nclscripts/csm/gsn_code.ncl"
>> >
>> > load "$NCARG_ROOT/lib/ncarg/nclscripts/csm/gsn_csm.ncl"
>> >
>> > load "$NCARG_ROOT/lib/ncarg/nclscripts/csm/contributed.ncl"
>> >
>> > ;************************************************
>> >
>> > begin
>> >
>> > ;************************************************
>> >
>> > ; get list of files
>> >
>> > ;************************************************
>> >
>> > diri = "pacific-12-2012/pacific/2012/12/" ; input directory
>> >
>> > fili = systemfunc("cd "+diri+" ; ls nodc_R5900666_288.nc")
>> >
>> > print(fili)
>> >
>> > nfili = dimsizes(fili)
>> >
>> >
>> >
>> > ;************************************************
>> >
>> > ; plot resources
>> >
>> > ;************************************************
>> >
>> > res = True ; plot mods desired
>> >
>> > res@trYReverse = True ; reverse Y-axis
>> >
>> > res@xyLineThicknessF = 2 ; choose dash patterns
>> >
>> > res@gsnDraw = False
>> >
>> > res@gsnFrame = False
>> >
>> >
>> >
>> > resP = True
>> >
>> > resP@gsnMaximize = True
>> >
>> >
>> >
>> > plot = new (2, "graphic")
>> >
>> > ;************************************************
>> >
>> > ; read in data: there is only 1 time, 1 lat, 1 lon
>> >
>> > ;************************************************
>> >
>> >
>> >
>> > do nf=0,nfili-1
>> >
>> > f = addfile (diri+fili(nf),"r")
>> >
>> > t = f->temperature(0,:,0,0)
>> >
>> > s = f->salinity(0,:,0,0)
>> >
>> >
>> >
>> > if (nf.eq.0) then
>> >
>> > printVarSummary(t)
>> >
>> > printVarSummary(s)
>> >
>> > end if
>> >
>> >
>> >
>> > ;************************************************
>> >
>> > ; plotting parameters
>> >
>> > ;************************************************
>> >
>> > sfx = get_file_suffix(fili(nf),0)
>> >
>> > pname = sfx@fBase
>> >
>> >
>> >
>> > wks = gsn_open_wks ("ps",pname)
>> >
>> > res@xyLineColors = (/"blue"/)
>> >
>> > plot(0) = gsn_csm_xy (wks,t,t&pressure,res) ; create plot
>> >
>> > res@xyLineColors = (/"red"/)
>> >
>> > plot(1) = gsn_csm_xy (wks,s,s&pressure,res) ; create plot
>> >
>> >
>> >
>> > resP@txString = fili(nf)
>> >
>> > gsn_panel(wks,plot,(/2,1/),resP) ; now draw as one plot
>> >
>> >
>> >
>> > delete([/t,s/]) ; may change size next file
>> >
>> > end do
>> >
>> >
>> >
>> > end
>> >
>> >
>> > is there any way I can plot the attached profile in one xy plot?
>> >
>> > It would be grateful if you can provide me with the assistance as soon as possible.
>> >
>> > Thanks
>> > Sachin.
>>
>> Sachin Ravilesh Nand | Software Engineer (Consultant)
>> B.C.A (Bangalore University-India)
>> European Union Global Climate Change Alliance Project.
>> Pacific Centre for Environment and Sustainable Development.
>> University of the South Pacific.
>> E:sachin.nand@usp.ac.fj <mailto:sachin.nand@usp.ac.fj>
>> T: (+679) 32 32205
>>
>> <nodc_R5900666_286.nc><nodc_R5900666_287.nc><nodc_R5900666_288.nc>_______________________________________________
>> ncl-talk mailing list
>> List instructions, subscriber options, unsubscribe:
>>http://mailman.ucar.edu/mailman/listinfo/ncl-talk
>
>
>
> _______________________________________________
> ncl-talk mailing list
> List instructions, subscriber options, unsubscribe:
> http://mailman.ucar.edu/mailman/listinfo/ncl-talk
>
_______________________________________________
ncl-talk mailing list
List instructions, subscriber options, unsubscribe:
http://mailman.ucar.edu/mailman/listinfo/ncl-talk