Date: Thu May 09 2013 - 13:43:15 MDT
Dear Mary,
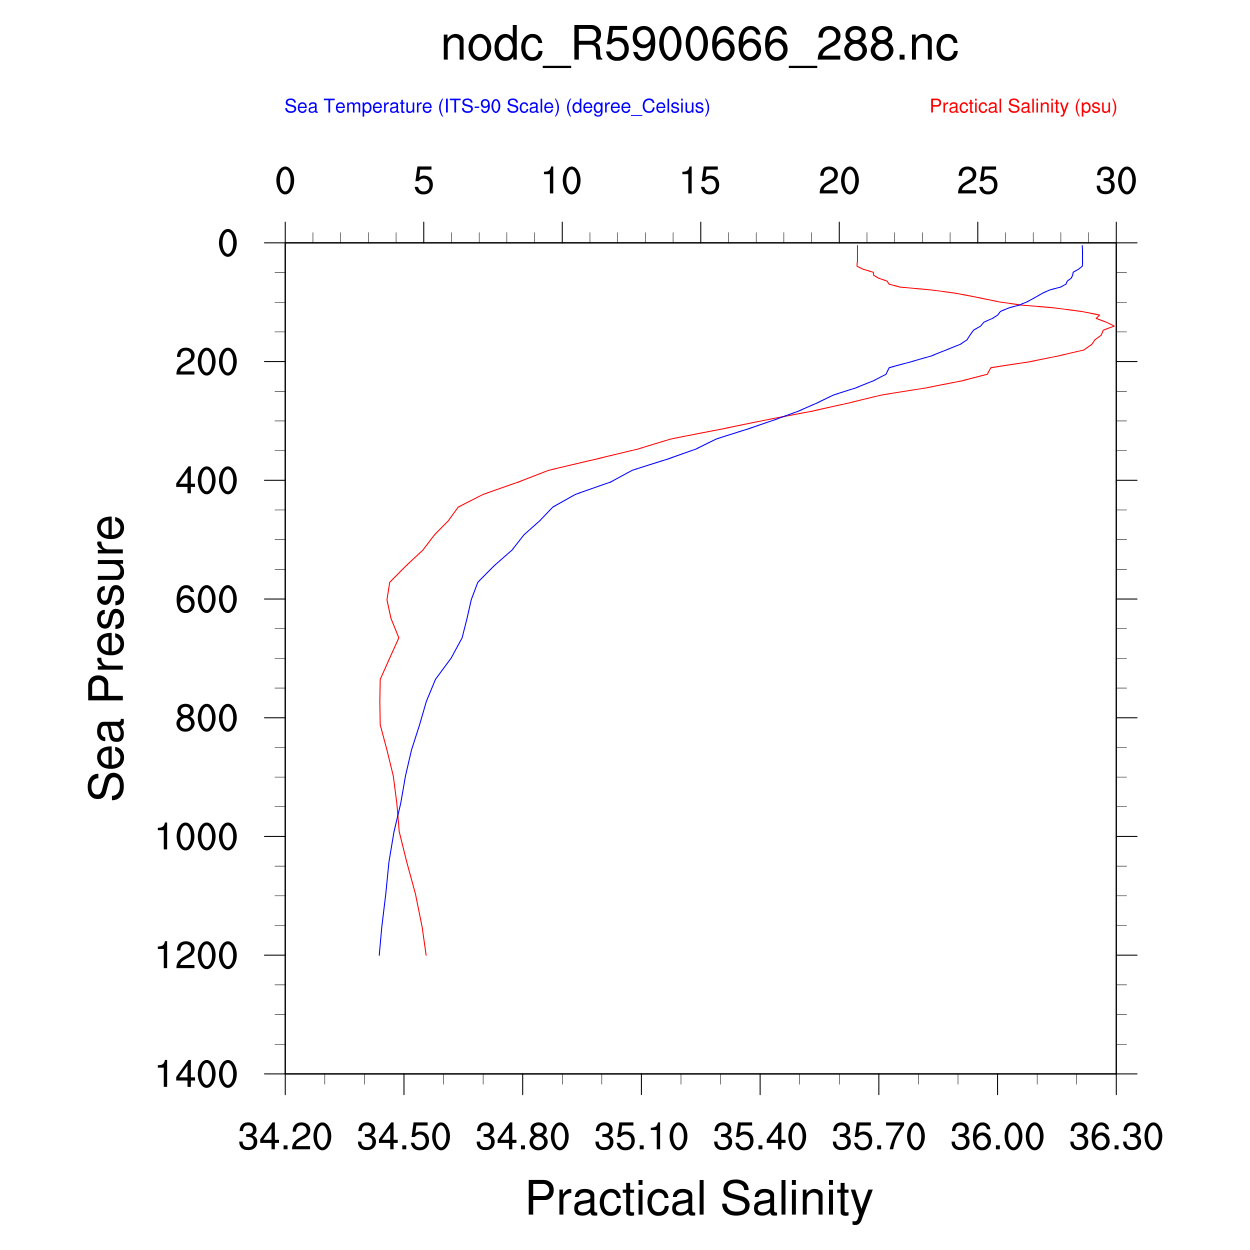
Thanks for your support online and I really appreciate that a lot. Ma'am, Actually the graph you have given me, I had done that before but I think my question to you was not very clear. What I wanted to request for is that, one float named as 5900666 has three profiles and all these three profiles generates 2 graphs respectively, i.e, TEMPERATURE vs PRESSURE and PRACTICAL SALINITY vs PRESSURE , therefore total of 6 graphs are generated from 3 profiles. So, my interest is into merging the 3 TEMPERATURE vs PRESSURE graph in to one XY plot from different profiles because I really find it difficult to call netCDF files from different profiles and merge the graphs into one plot. For example, all TEMPERATURE vs PRESSURE in one plot from all the 3 profiles. Attached are the ".nc" files with "nodc.ncl" file and can you please assist me in this.
With many thanks.
Sachin Ravilesh Nand | Software Engineer (Consultant)
B.C.A (Bangalore University-India)
European Union Global Climate Change Alliance Project.
Pacific Centre for Environment and Sustainable Development.
University of the South Pacific.
E: sachin.nand@usp.ac.fj<mailto:sachin.nand@usp.ac.fj>
T: (+679) 32 32205
From: Mary Haley [mailto:haley@ucar.edu]
Sent: Thursday, May 09, 2013 3:34 AM
To: nand_s
Cc: ncl-talk@ucar.edu
Subject: Re: Request
If I understand your request, you want to put both curves in the same plot. To do this, you can use "gsn_csm_x2y". This function assumes that you have two curves with different X axes, but the same Y axis values. See the attached modification to your code and a PNG.
Please try to understand these scripts that we send you before sending more requests for help. We have some tips on where to get help on our "tips and posting guidelines" page:
http://www.ncl.ucar.edu/Support/posting_guidelines.shtml
Good luck,
--Mary
[cid:image001.png@01CE4D51.D1FC5DB0]
On May 7, 2013, at 4:08 PM, nand_s wrote:
>
> Hello Recipient,
>
> Thank you very much, I really appreciate your assistance. I have gone through each and every response I have got from NCL developers but I was bit confused at some response that's why what ever addition to the code I was given by NCL developers I use to paste it in my original NCL code and run it but still all the time its generating some errors. This is the original code and i wanted to request for the code which can merge the profiles of a single float. The given code generates separate graph's for different profiles.
> >
> > load "$NCARG_ROOT/lib/ncarg/nclscripts/csm/gsn_code.ncl"
> >
> > load "$NCARG_ROOT/lib/ncarg/nclscripts/csm/gsn_csm.ncl"
> >
> > load "$NCARG_ROOT/lib/ncarg/nclscripts/csm/contributed.ncl"
> >
> > ;************************************************
> >
> > begin
> >
> > ;************************************************
> >
> > ; get list of files
> >
> > ;************************************************
> >
> > diri = "pacific-12-2012/pacific/2012/12/" ; input directory
> >
> > fili = systemfunc("cd "+diri+" ; ls nodc_R5900666_288.nc")
> >
> > print(fili)
> >
> > nfili = dimsizes(fili)
> >
> >
> >
> > ;************************************************
> >
> > ; plot resources
> >
> > ;************************************************
> >
> > res = True ; plot mods desired
> >
> > res@trYReverse = True ; reverse Y-axis
> >
> > res@xyLineThicknessF = 2 ; choose dash patterns
> >
> > res@gsnDraw = False
> >
> > res@gsnFrame = False
> >
> >
> >
> > resP = True
> >
> > resP@gsnMaximize = True
> >
> >
> >
> > plot = new (2, "graphic")
> >
> > ;************************************************
> >
> > ; read in data: there is only 1 time, 1 lat, 1 lon
> >
> > ;************************************************
> >
> >
> >
> > do nf=0,nfili-1
> >
> > f = addfile (diri+fili(nf),"r")
> >
> > t = f->temperature(0,:,0,0)
> >
> > s = f->salinity(0,:,0,0)
> >
> >
> >
> > if (nf.eq.0) then
> >
> > printVarSummary(t)
> >
> > printVarSummary(s)
> >
> > end if
> >
> >
> >
> > ;************************************************
> >
> > ; plotting parameters
> >
> > ;************************************************
> >
> > sfx = get_file_suffix(fili(nf),0)
> >
> > pname = sfx@fBase
> >
> >
> >
> > wks = gsn_open_wks ("ps",pname)
> >
> > res@xyLineColors = (/"blue"/)
> >
> > plot(0) = gsn_csm_xy (wks,t,t&pressure,res) ; create plot
> >
> > res@xyLineColors = (/"red"/)
> >
> > plot(1) = gsn_csm_xy (wks,s,s&pressure,res) ; create plot
> >
> >
> >
> > resP@txString = fili(nf)
> >
> > gsn_panel(wks,plot,(/2,1/),resP) ; now draw as one plot
> >
> >
> >
> > delete([/t,s/]) ; may change size next file
> >
> > end do
> >
> >
> >
> > end
> >
> >
> > is there any way I can plot the attached profile in one xy plot?
> >
> > It would be grateful if you can provide me with the assistance as soon as possible.
> >
> > Thanks
> > Sachin.
>
> Sachin Ravilesh Nand | Software Engineer (Consultant)
> B.C.A (Bangalore University-India)
> European Union Global Climate Change Alliance Project.
> Pacific Centre for Environment and Sustainable Development.
> University of the South Pacific.
> E: sachin.nand@usp.ac.fj<mailto:sachin.nand@usp.ac.fj>
> T: (+679) 32 32205
>
> <nodc_R5900666_286.nc><nodc_R5900666_287.nc><nodc_R5900666_288.nc>_______________________________________________
> ncl-talk mailing list
> List instructions, subscriber options, unsubscribe:
> http://mailman.ucar.edu/mailman/listinfo/ncl-talk
_______________________________________________
ncl-talk mailing list
List instructions, subscriber options, unsubscribe:
http://mailman.ucar.edu/mailman/listinfo/ncl-talk
- application/octet-stream attachment: nodc_R5900666_286.nc
- application/octet-stream attachment: nodc_R5900666_287.nc
- application/octet-stream attachment: nodc_R5900666_288.nc
- application/octet-stream attachment: nodc.ncl