Date: Tue Jun 11 2013 - 12:38:03 MDT
Hi Mary,
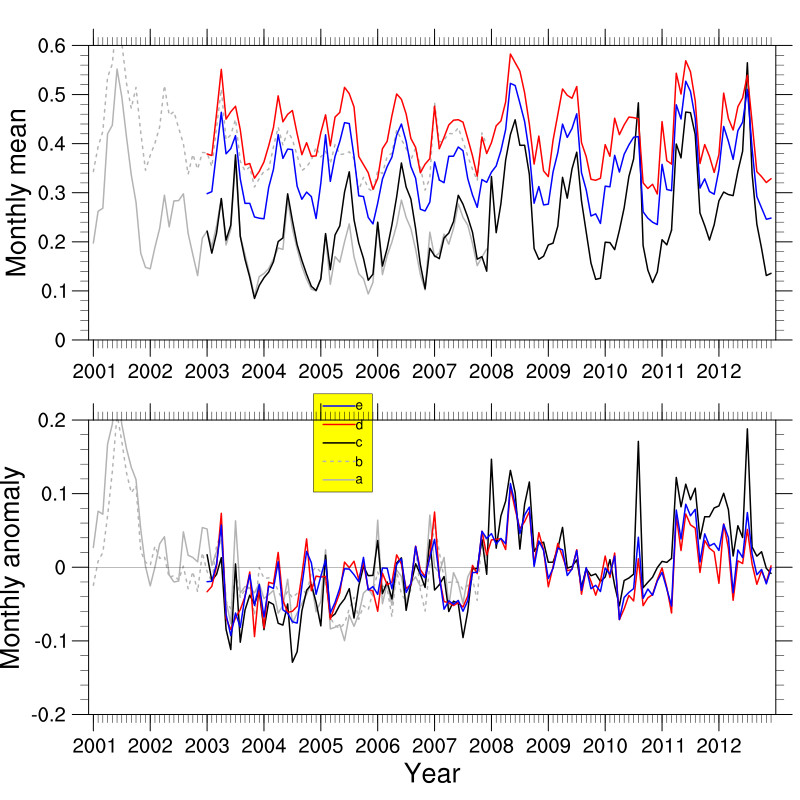
I did look at the examples, but the lgPerimFill does not work on the plot
border. I have attached my figure.
The related part of res is:
resxy@pmLegendDisplayMode = "Always"
resxy@pmLegendSide = "Top"
resxy@pmLegendOrthogonalPosF = -0.3
resxy@pmLegendParallelPosF = .37
resxy@pmLegendWidthF = 0.06
resxy@pmLegendHeightF = 0.1
resxy@lgLabelFontHeightF = .01
resxy@lgPerimOn = True
resxy@lgPerimFill = "Solid" ; or "SolidFill", neither works.
resxy@lgPerimFillColor = "yellow"
resxy@xyExplicitLegendLabels = (/"a","b","c","d","e"/)
On Tue, Jun 11, 2013 at 1:55 PM, Mary Haley <haley@ucar.edu> wrote:
> Did you look at example lg_10.ncl at:
>
> http://www.ncl.ucar.edu/Applications/legend.shtml
>
> This talks about using lgPerimFill and lgPerimFillColor.
>
> If you are trying these resources and it still doesn't work, then please
> provide your script and data, if possible, so we can take a look. You can
> use our ftp site to upload the files:
>
> http://www.ncl.ucar.edu/report_bug.shtml#HowToFTP
>
> --Mary
>
>
> On Jun 11, 2013, at 10:37 AM, Xin Xi wrote:
>
> >
> > Hi How can I make the legend appear above the plot border? Even if I set
> lgPerim to solidfill, it is still transparent to the plot box. Pls see
> attached example. Thanks.
> > Xin
> > <BoxPlot.png>_______________________________________________
> > ncl-talk mailing list
> > List instructions, subscriber options, unsubscribe:
> > http://mailman.ucar.edu/mailman/listinfo/ncl-talk
>
>
--
*Xin Xi
School of Earth and Atmospheric Sciences
Georgia Institute of Technology
311 Ferst Drive, Atlanta, GA 30332-0340*
_______________________________________________
ncl-talk mailing list
List instructions, subscriber options, unsubscribe:
http://mailman.ucar.edu/mailman/listinfo/ncl-talk