Date: Thu Aug 08 2013 - 13:54:14 MDT
Hi,
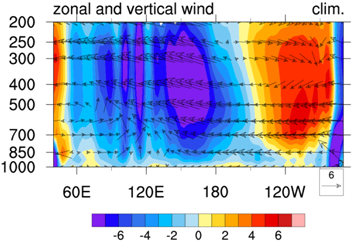
I make a pressure-longitude plot with Y axis from 1000mb to 200mb. The
vectors at the boundaries (1000mb and 200mb) are invisible. I'd like to
enlarge the Y axis range (say from 1010 to 190) to make the vectors
visible. How can I do this? The resources trYMinF/trYMaxF only work for xy
plot.
Thanks,
Jian
[image: Inline image 1]
_______________________________________________
ncl-talk mailing list
List instructions, subscriber options, unsubscribe:
http://mailman.ucar.edu/mailman/listinfo/ncl-talk