Date: Fri Aug 23 2013 - 10:23:57 MDT
Dear NCL users
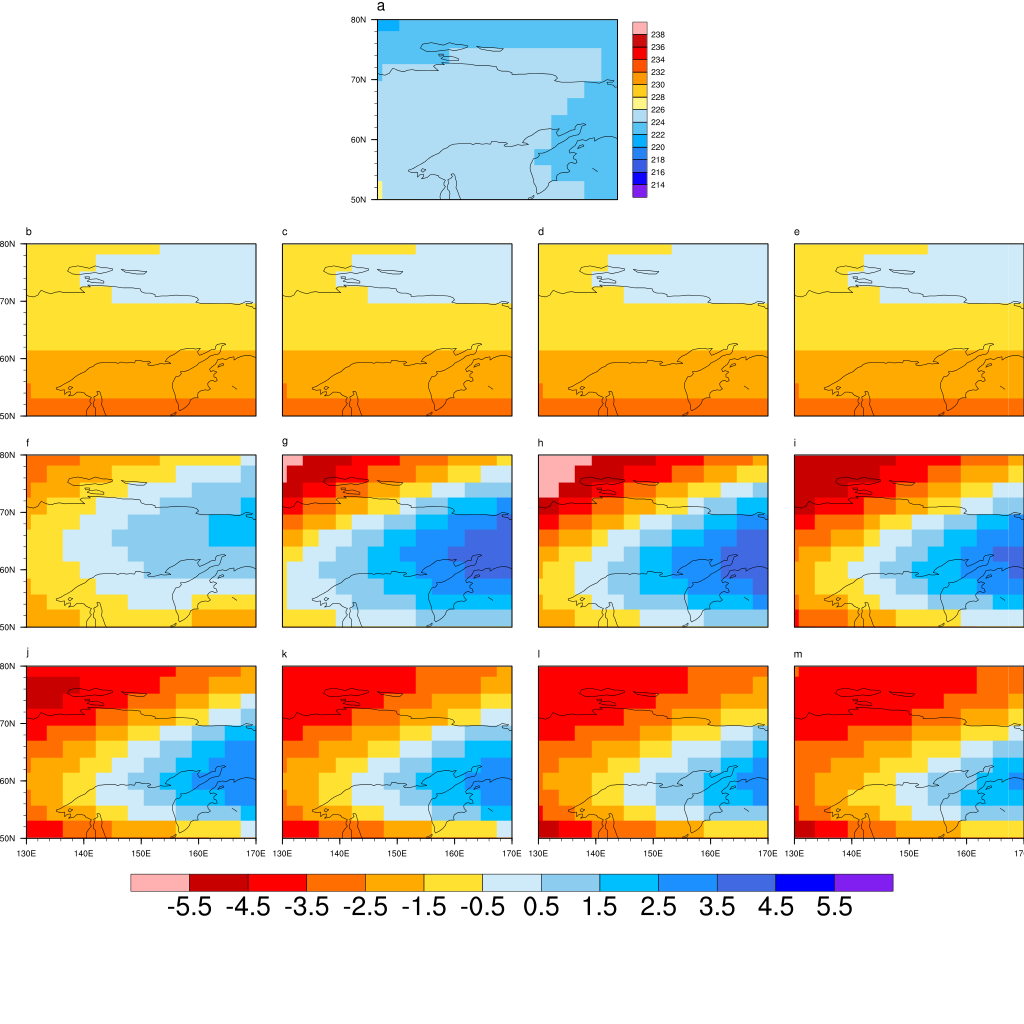
I'm trying to plot multiple panel plot with different color palette.
Basically I want the first plot to have the colors of "precip_11lev" and
the rest "ncl_default" but with white color between -0.5 and 0.5.
I was wondering if someone could tell me where to add the options to get
the desired results and if its possible to make the script shorter.
Attached are an example script and the result I'm having.
The data I'm using is available at
http://www.ncl.ucar.edu/Applications/Data/cdf/atmos.nc
Thanks in advance
Izidine
--
_______________________________________________
ncl-talk mailing list
List instructions, subscriber options, unsubscribe:
http://mailman.ucar.edu/mailman/listinfo/ncl-talk
- application/octet-stream attachment: panel.ncl