Date: Fri Oct 25 2013 - 14:13:45 MDT
Hi Paula,
I don't know if you want to do this or not, you can also subset the data
to increase the plotting speed and decrease the workstation size
requirements. Change this:
resH@sfYArray=lats_Huron
resH@sfXArray=lons_Huron
plot_Huron=gsn_csm_contour(wks,b_Huron,resH)
to this:
resH@sfYArray=lats_Huron(::4)
resH@sfXArray=lons_Huron(::4)
plot_Huron=gsn_csm_contour(wks,b_Huron(::4,::4),resH)
(and do the same thing for the Lake Michigan section of code)
That will plot every 4th grid point. You can try other numbers, 2, 3 or
5 for instance..
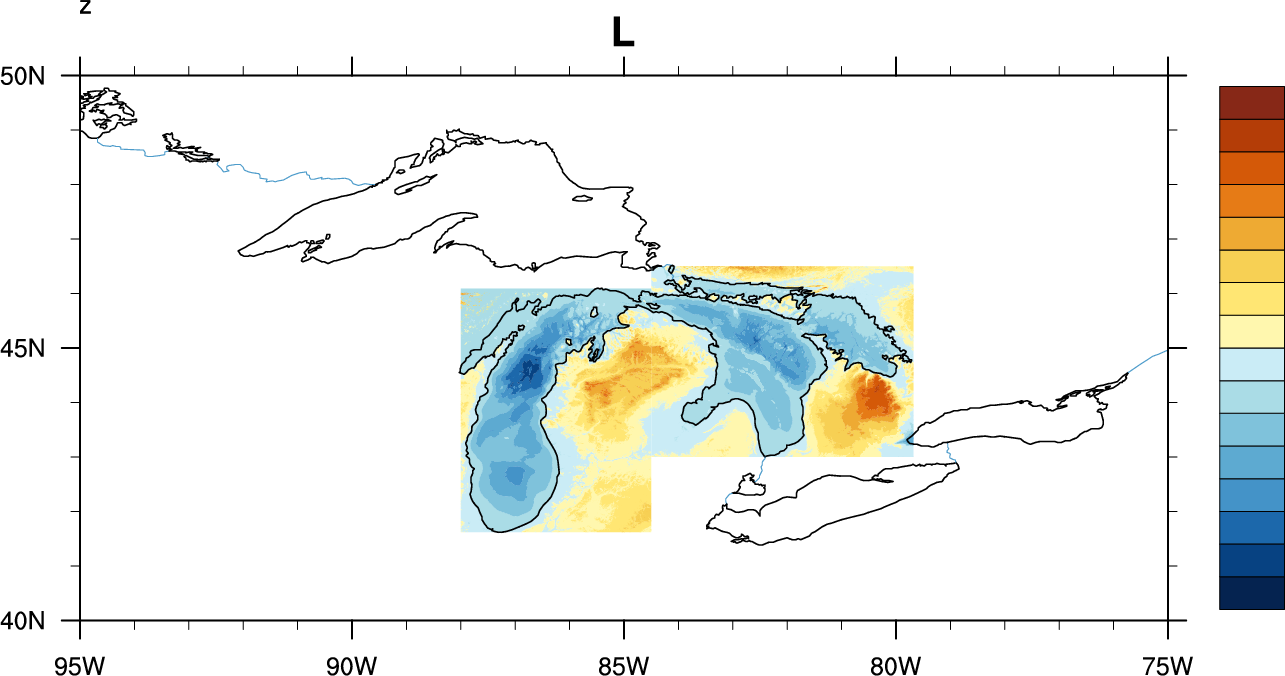
Results are attached showing every 4th grid point plotted.
Adam
On 10/25/2013 09:41 AM, Paula Doubrawa wrote:
> Thank you very much, Adam.
>
> I am indeed using "RasterFill"!
>
> With "CellFill" minutes and minutes go by while drawing and I end up
> having to kill the script because my computer starts freezing...
>
> With "AreaFill" I get fatal errors after a few seconds of attempting
> to plot:
> /*fatal:_NhlUseWorkspace: Allocation of workspace would exceed maximum
> total size*/
> /*fatal:ContourPlotDraw: error reserving label area map workspace*/
> /*fatal:ContourPlotDraw: Error reserving workspace*/
> /*fatal:ContourPlotDraw: draw error*/
> /*warning:WorkstationDeactivate: workstation not active or not opened*/
> /*
> fatal:ContourPlotDraw: Workspace reallocation would exceed maximum
> size 100000000
> fatal:ContourPlotDraw: draw error
> warning:WorkstationDeactivate: workstation not active or not opened
>
> */
> Do you have any other suggestions? Is the problem that the data is too
> high-res?
>
> If needed:
> Attached is the code, and data is here:
> http://www.ngdc.noaa.gov/mgg/greatlakes/michigan.html
>
>
>
> On Fri, Oct 25, 2013 at 11:14 AM, Adam Phillips <asphilli@ucar.edu
> <mailto:asphilli@ucar.edu>> wrote:
>
> Hi Paula,
> I believe it matters whether you are setting res2@cnFillMode =
> "RasterFill". Areas of _FillValue (or areas beyond the range of
> the grid) are set to transparent with cnFillMode = "AreaFill"
> (=default) or cnFillMode = "CellFill". However, if cnFillMode =
> "RasterFill", then transparency is not supported, and those areas
> set to _FillValue or outside the range of the grid are set to the
> background color (usually white)..
>
> http://www.ncl.ucar.edu/Document/Graphics/Resources/cn.shtml#cnFillMode
> http://www.ncl.ucar.edu/Document/Graphics/Resources/cn.shtml#cnOutOfRangeFillColor
>
> If you are setting res2@cnFillMode = "RasterFill", see if changing
> that resource to "CellFill" gets your overlay working.
>
> If the above does not apply, please include your complete resource
> list / plotting section of your script in your reply to ncl-talk..
> Adam
>
> On 10/24/2013 06:38 PM, Paula Doubrawa wrote:
>> Hello, all!
>>
>> I am overlaying filled contours on a map (basic overlay
>> procedure, see below).
>>
>> The different plots cover different regions of my map.
>>
>> If I plot one with filled contours and the other without filled
>> contours (only lines) then it works!
>>
>> If I try to plot them both with filled contours, only the last
>> one to be overlaid appears in the final plot, it's overwriting
>> the first plot that was overlaid!
>>
>> Has anyone run into this?!
>>
>> Any help appreciated!
>>
>> Thank you very much
>> Paula
>>
>> /map=gsn_csm_map(wks,mpres)/
>> /plot1=gsn_csm_contour(wks,data1,res1)/
>> /plot2=gsn_csm_contour(wks,data2,res2)/
>> /
>> /
>> /overlay(map,plot1)/
>> /overlay(map,plot2)/
>> /
>> /
>> /draw(map)/
>> /frame(wks)/
>>
>>
>> _______________________________________________
>> ncl-talk mailing list
>> List instructions, subscriber options, unsubscribe:
>> http://mailman.ucar.edu/mailman/listinfo/ncl-talk
>
> --
> ______________________________________________________________
> Adam Phillipsasphilli@ucar.edu <mailto:asphilli@ucar.edu>
> NCAR/Climate and Global Dynamics Division(303) 497-1726 <tel:%28303%29%20497-1726>
> P.O. Box 3000
> Boulder, CO 80307-3000http://www.cgd.ucar.edu/cas/asphilli
>
>
>
>
> _______________________________________________
> ncl-talk mailing list
> List instructions, subscriber options, unsubscribe:
> http://mailman.ucar.edu/mailman/listinfo/ncl-talk
--
______________________________________________________________
Adam Phillips                                asphilli@ucar.edu
NCAR/Climate and Global Dynamics Division       (303) 497-1726
P.O. Box 3000
Boulder, CO 80307-3000    http://www.cgd.ucar.edu/cas/asphilli
_______________________________________________
ncl-talk mailing list
List instructions, subscriber options, unsubscribe:
http://mailman.ucar.edu/mailman/listinfo/ncl-talk