Date: Tue Nov 12 2013 - 18:16:03 MST
Hello,
I attempted to use the ncl t-test function to test the significance of
results from a sensitivity test using a regional climate model. Prior to
this, I extracted output from two specific locations and conducted a
t-test using R and the results were significant for both locations. I
had noticed that the variances appeared quite different for the two
model scenarios so I used the Welch's t-test in R (which, unlike the
Students t-test assumes that the variances of the two samples are not
the same).
The output is in the form of seasonal averages over 25 years. The files
for the two model scenarios have been uploaded to the ftp site and are
entitled: SRF.wet8510.nc and SRF.wet8510N.nc
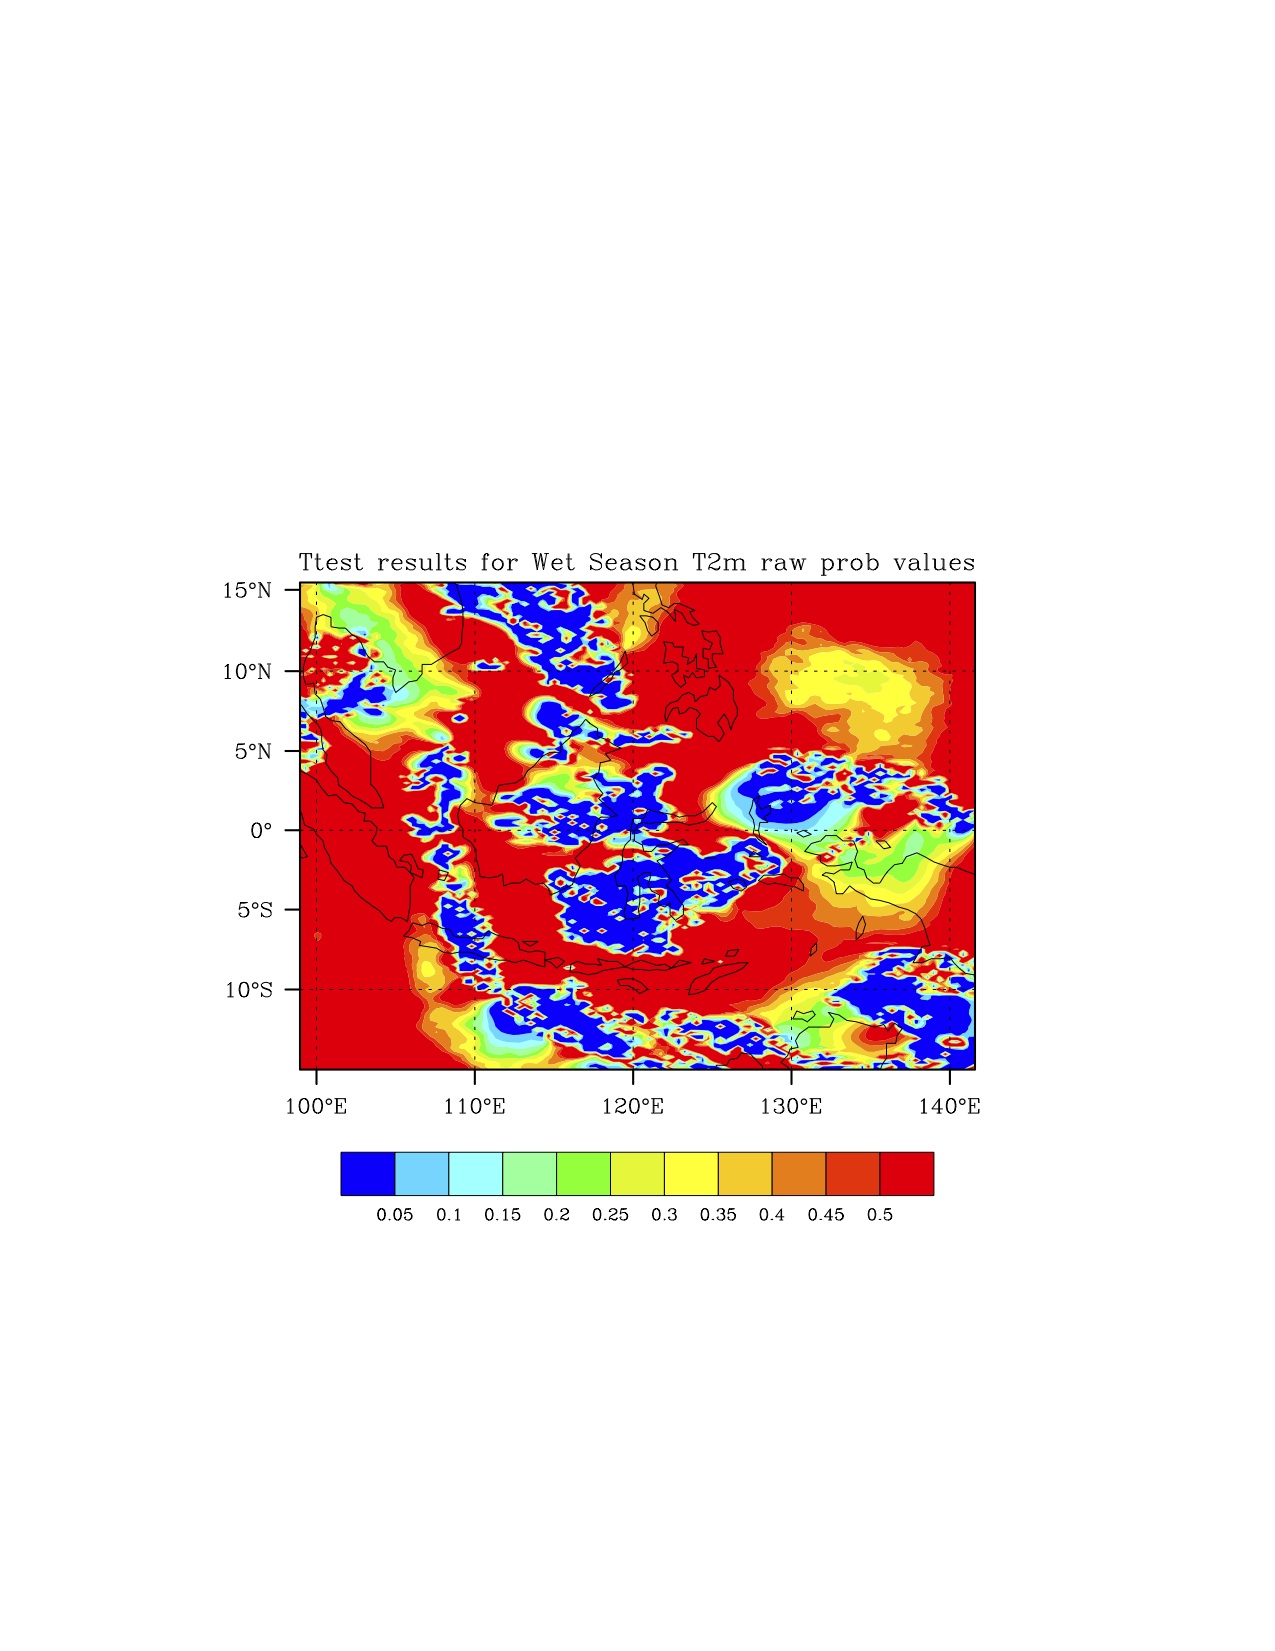
However, when I attempted to use the ncl function, the resulting plot
(and raw probability results) showed very few areas of significant
difference over the domain, and none of those areas overlapped with the
two locations I independently tested. I've attached my script and a
sample plot of the raw probability results.
I am wondering if someone can tell me how the ncl function actually
works (if I could possibly see the original code), especially how iflag
works and how the ttest function calculates variances. Also, if the
option for different variances is working the same way as the Welch's
t-test. If the option isn't working, I was hoping that someone has
written an alternative script which incorporates the Welch's t-test or
similarly accounts for different variances.
Thank you.
Regards,
Heidi
--
Heidi L. Stauffer
PhD Candidate
Paleoclimate and Climate Change Modeling Group
Earth & Planetary Sciences Department
University of California, Santa Cruz
_______________________________________________
ncl-talk mailing list
List instructions, subscriber options, unsubscribe:
http://mailman.ucar.edu/mailman/listinfo/ncl-talk
- text/rtf attachment: ttest_T2m_ncl_script.rtf