**PLEASE .. in the future, include an appropriate Subject.**
**Next time ... no one will answer**
=========================
[1] As noted in all the SVD function documentation, they will not
handle any data values tagged as _FillValue.
I think what you did was
x&_FillValue = 0.0
This will change the _FillValue to 0.0 but I the function
still 'sees' it is tagged as _FillValue. Add the following
after the above
delete(x&_FillValue)
The function will not recognize 0.0 as anything special.
If that does not work, I'm not sure what to do.
How would, say, Matlab handle missing values?
[2] svdcov is something Bretherton et al discuss. It is an
application of SVD. See the function documentation.
**Note the caveat.**
svdcov_sv is basically a direct application of an LAPACK
SVD subroutine to the covariance matrix derived from
the input x and y arrays
On 11/26/13 10:26 AM, Hui Ding wrote:
> Dear Madam/Sir,
> I have to perform MCA analysis. I found two functions svdcor_sv and
> svdcov available. What are the differences between them? Which one should I
> use for the MCA analysis? In addition, what can I do with missing values
> from continents when I am analysing sea surface temperature? I always get
> the following information when there are some missing values or when I set
> missing values to 0 in continents. Thank you very much!
> Best regards,
> Hui
>
> Here is the information I get:
> SVD: Warning all Y values in column are missing or are constant
> SVD: Warning all Y values in column are missing or are constant
> SVD: Warning all Y values in column are missing or are constant
> SVD: Warning all Y values in column are missing or are constant
> SVD: Warning all Y values in column are missing or are constant
> SVD: Warning all Y values in column are missing or are constant
> SVD: Warning all Y values in column are missing or are constant
> SVD: Warning all Y values in column are missing or are constant
>
>
>
> 2013/11/25 <ncl-talk-request@ucar.edu>
>
>> Send ncl-talk mailing list submissions to
>> ncl-talk@ucar.edu
>>
>> To subscribe or unsubscribe via the World Wide Web, visit
>> http://mailman.ucar.edu/mailman/listinfo/ncl-talk
>> or, via email, send a message with subject or body 'help' to
>> ncl-talk-request@ucar.edu
>>
>> You can reach the person managing the list at
>> ncl-talk-owner@ucar.edu
>>
>> When replying, please edit your Subject line so it is more specific
>> than "Re: Contents of ncl-talk digest..."
>>
>>
>> Today's Topics:
>>
>> 1. gsn_panel issues (A.J. Eiserloh)
>>
>>
>> ----------------------------------------------------------------------
>>
>> Message: 1
>> Date: Mon, 25 Nov 2013 10:58:04 -0800
>> From: "A.J. Eiserloh" <arthur.eiserloh@gmail.com>
>> Subject: gsn_panel issues
>> To: "ncl-talk@ucar.edu USERS" <ncl-talk@ucar.edu>
>> Message-ID:
>> <
>> CAGoaJHwF055fUYPA7mjws5pdzTCU3-6GVt+b23oQzZauYMxV_A@mail.gmail.com>
>> Content-Type: text/plain; charset="iso-8859-1"
>>
>> Hi all,
>>
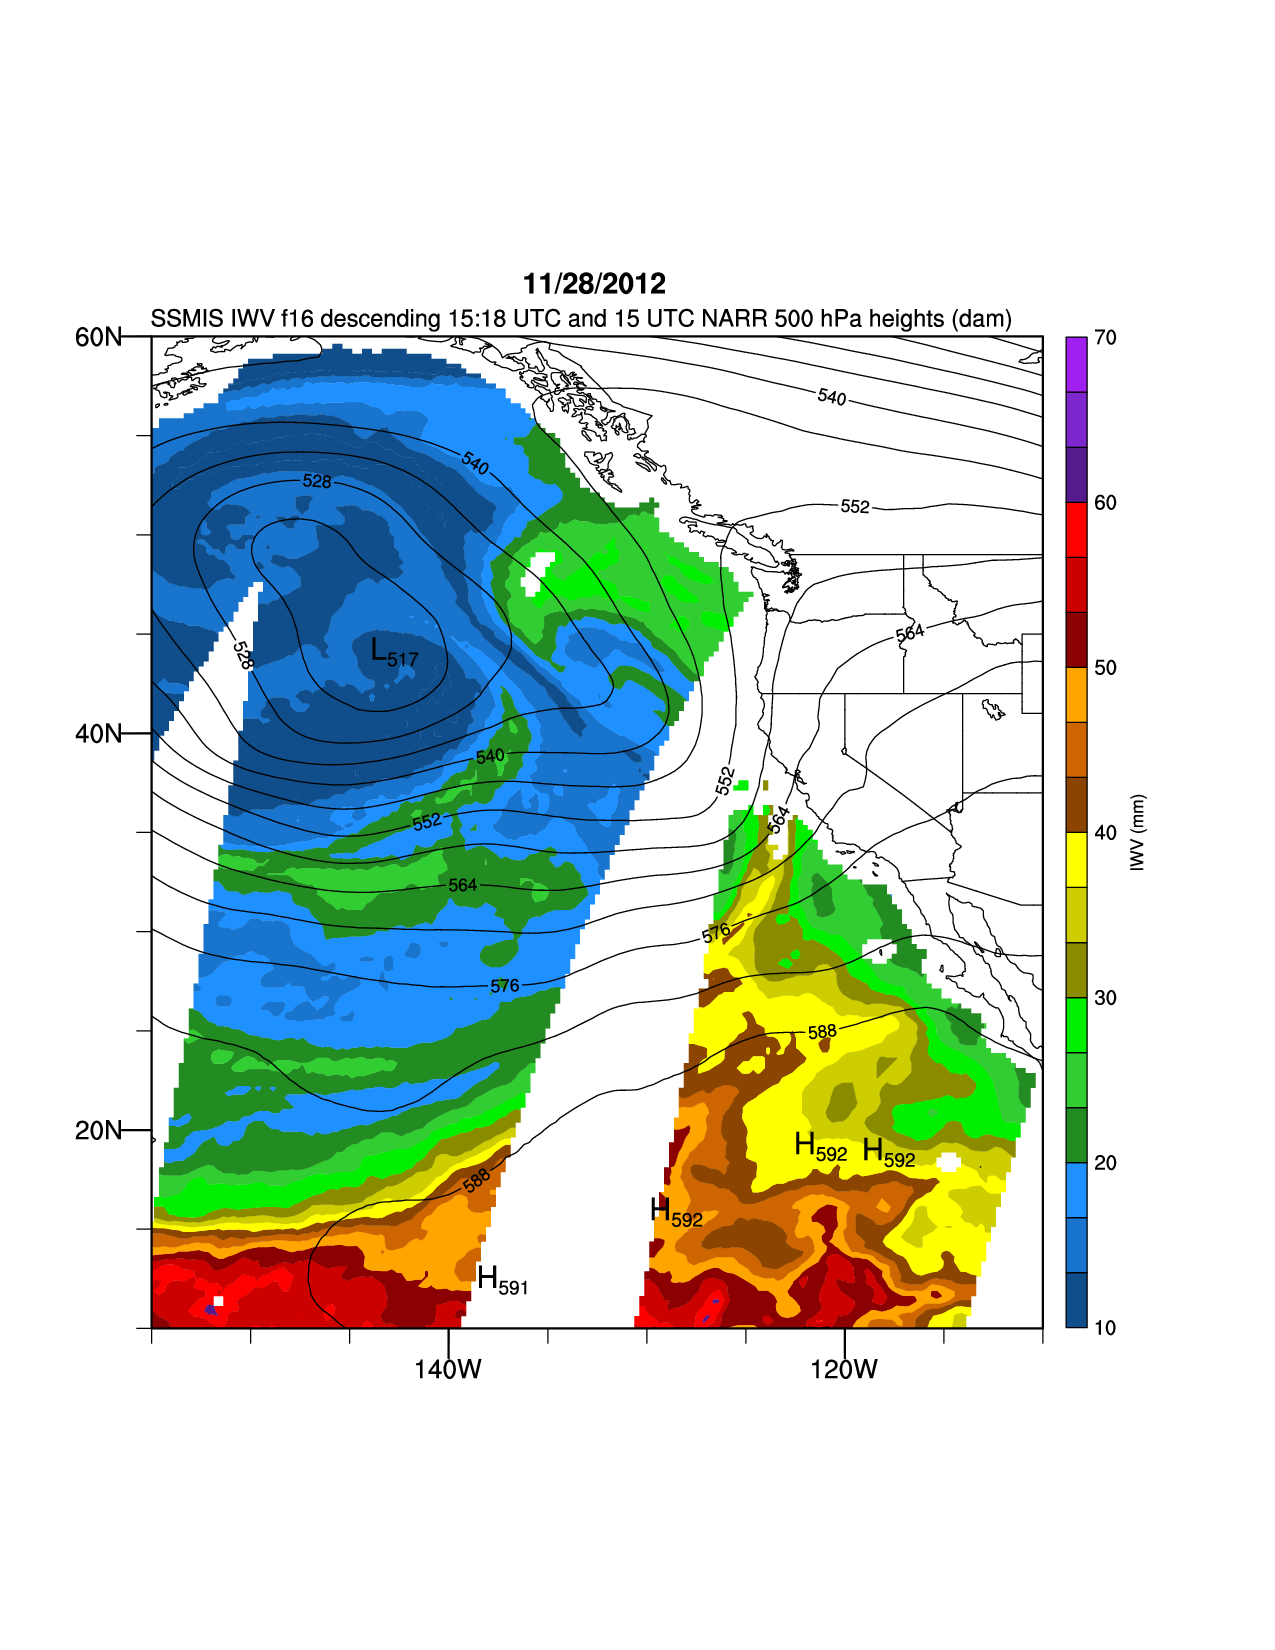
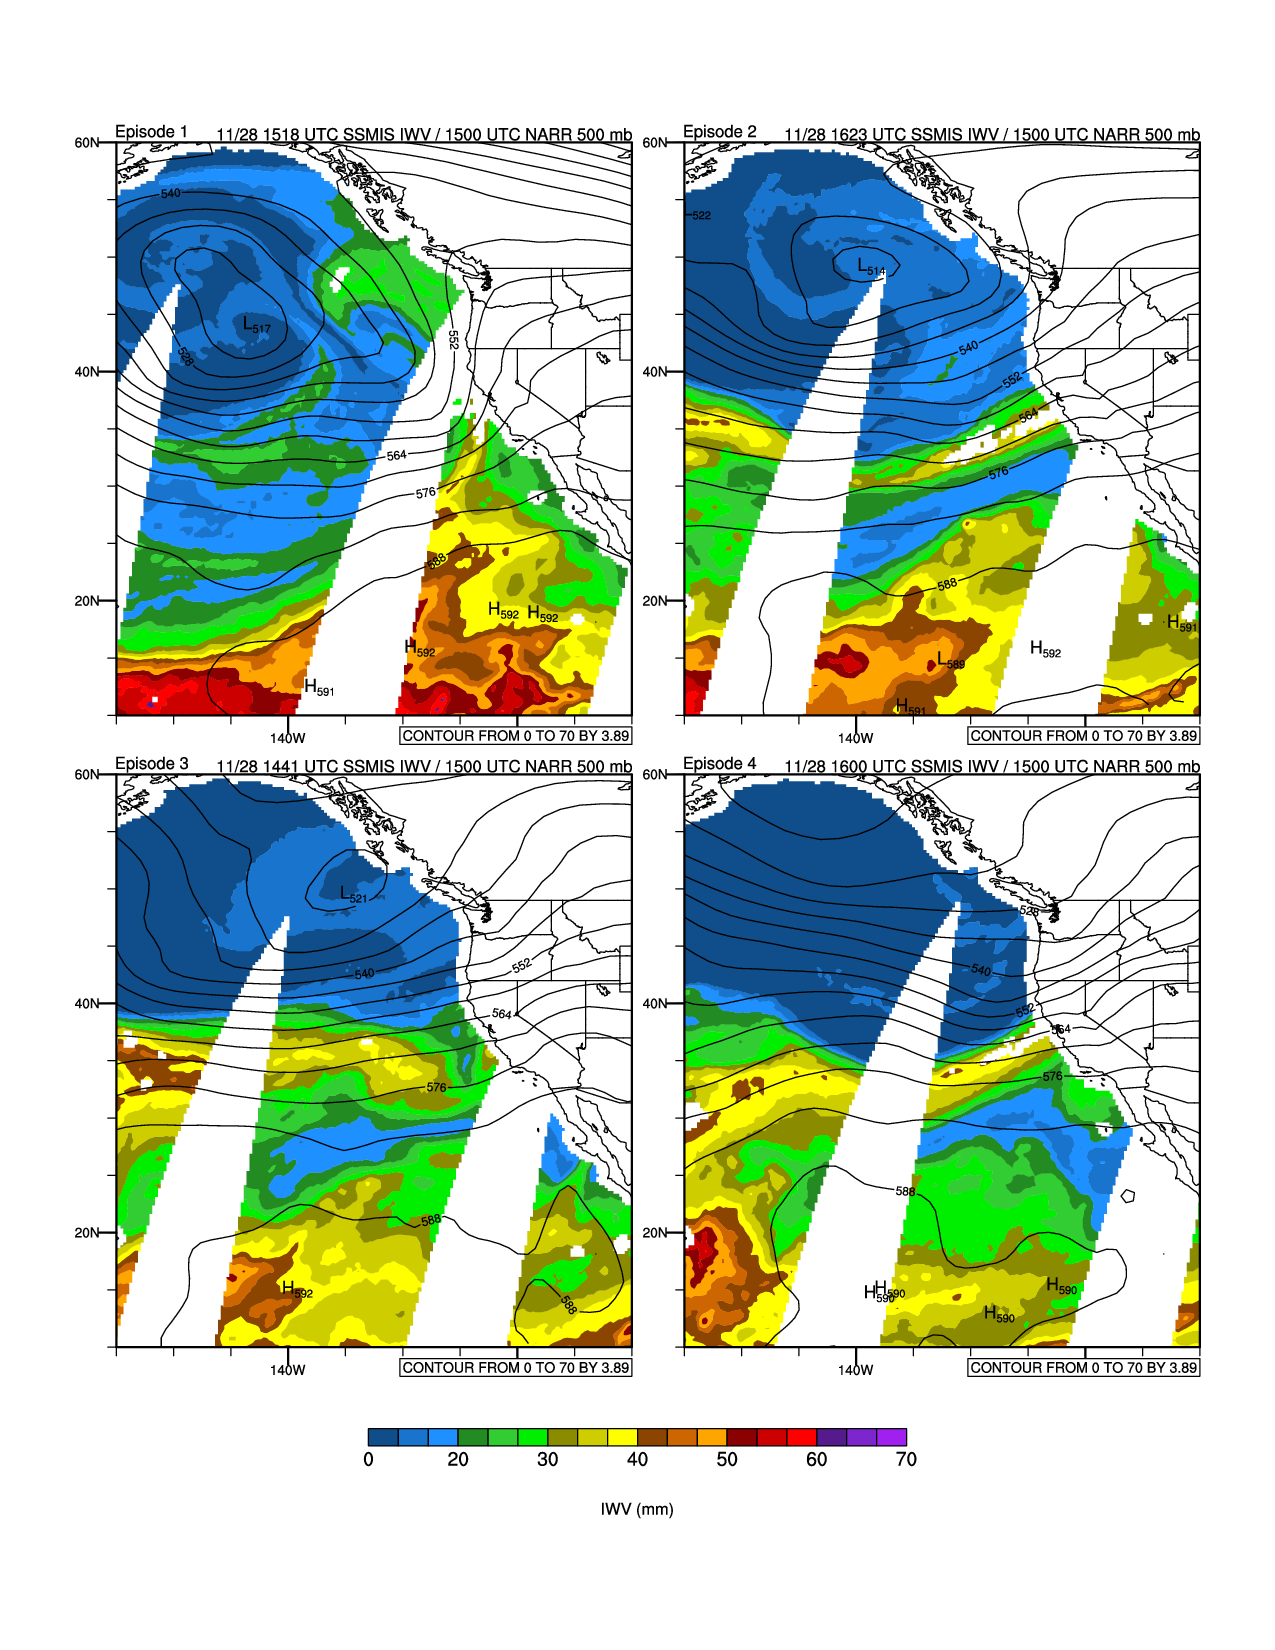
>> I made a plot of overlaying NARR 500 hPa contours on top of SSMIS
>> Integrated Water Vapor. That plot looks great, but when I try to make a
>> (/2,2/) panel plot for 4 of the same images, ncl seems to ignore some of my
>> resources. Specifically, I tell it to turn it off the contour Info Label
>> box by setting that option cnInfoLabelBar = False. Also, I want the
>> labelbar to span across the entire page (from the beginning of the bottom
>> left plot to the end of the bottom right). I thought the resources
>> lbLeftMarginF
>> =0 and lbRightMarginF = 0 would fix this but it has not. I am not sure why
>> ncl is ignoring these 2 resources and what I can to to fix these things. I
>> will attach both images along with my code:
>>
>>
>>
>>
>> ;***************************************************************************
>> load "$NCARG_ROOT/lib/ncarg/nclscripts/csm/gsn_code.ncl"
>> load "$NCARG_ROOT/lib/ncarg/nclscripts/csm/gsn_csm.ncl"
>> load "$NCARG_ROOT/lib/ncarg/nclscripts/csm/contributed.ncl"
>>
>> begin
>>
>> ;create function to read ssmi file
>> undef("get_var_ssmi")
>> function get_var_ssmi(f[1]:file,var[1]:string)
>> ; local utility function for cleaner code
>> local xs, x, ymdh
>> begin
>> xs = f->$var$
>> xs = where(xs.ge.toshort(251), toshort(255), xs)
>> xs@_FillValue = toshort(255) ; CF conforming
>>
>> x = short2flt(xs)
>>
>> delete(x&time) ; delete type dhort
>> ymdh = cd_calendar(xs&time, -3) ; yyyymmddhh
>> x&time = ymdh
>> return(x)
>> end
>>
>> ;get info for each episode
>> ; 1 2 3 4
>> time=(/"1518 UTC","1623 UTC","1441 UTC","1600 UTC"/)
>> date=(/"20121128","20121130","20121201","20121202"/)
>> swath="descending"
>> satnum=(/"f16","f17","f16","f17"/)
>>
>> fname = "iwv_episodes_panel"
>> wks = gsn_open_wks ("ps", fname)
>>
>>
>> ;;;;;;;;;;;;;;;;;;;;;;;;;;;;;;;;;;;;;;;;;;;;;;;;;;;;;;;;;;;;;;;;;;;;;;;;;;;;
>> ; MAKE PANEL PLOTS
>>
>> ;;;;;;;;;;;;;;;;;;;;;;;;;;;;;;;;;;;;;;;;;;;;;;;;;;;;;;;;;;;;;;;;;;;;;;;;;;;;
>> plots = new(4,graphic)
>>
>> do i=0,3
>>
>> ssmis_fin="./"+satnum(i)+"/"+satnum(i)+"_ssmis_"+date(i)+"v7.nc"
>> narr_fin="../NARR/data/narr-a_221_"+date(i)+"_1500_000.grb"
>> f=addfile(ssmis_fin,"r")
>> n=addfile(narr_fin,"r")
>>
>> ;============================================================================
>>
>> ;============================================================================
>>
>> iwv0 = get_var_ssmi(f, "atmosphere_water_vapor_content")
>> if(swath.eq."descending") then
>> iwv = iwv0(0,:,:)
>> else
>> iwv = iwv0(1,:,:)
>> end if
>> ;*************create
>>
>> plots**************************************************************************
>> ;
>> ; colors for iwv plot
>> colors =
>>
>> (/"dodgerblue4","dodgerblue4","dodgerblue3","dodgerblue","forestgreen","limegreen","green2","yellow4","yellow3","yell
>> ow1",\
>>
>>
>> "darkorange4","darkorange3","orange","red4","red3","red","purple4","purple3","purple"/)
>>
>> ; iwv plot resources
>> res =True
>> res@gsnDraw =False
>> res@gsnFrame =False
>> res@gsnAddCyclic =False
>> res@sfXArray =iwv&longitude
>> res@sfYArray =iwv&latitude
>>
>> res@cnFillOn = True ; turn on color fill
>> res@cnLinesOn = False ; Turn off contour lines
>> res@cnLineLabelsOn = False ; Turn off contour lines
>> res@cnLevelSelectionMode = "ExplicitLevels"
>> res@lbLabelBarOn = False
>> res@lbLabelAutoStride = False
>> res@cnLabelBarEndStyle = "ExcludeOuterBoxes" ; stop ncl from
>> adding two extra boxes on label bar
>> res@cnLevels = (/10, 13.33333,16.66667,20,23.33333,26.66667,30, \
>> 33.33333,36.66667,40,43.33333,46.66667,50, \
>> 53.33333,56.66667,60,63.33333,66.66667,70 /)
>> res@cnFillColors = colors
>>
>> ; res@cnExplicitLabelBarLabelsOn
>>
>> res@gsnLeftString = " "
>> res@gsnRightString = " "
>>
>> iwv_plot = gsn_csm_contour(wks,iwv,res)
>>
>>
>> ;=============================================================================
>> ;Height
>>
>> ;=============================================================================
>>
>> hgt = n->HGT_221_ISBL(12,:,:)
>> hgt = hgt/10.0
>> lat2d = n->gridlat_221
>> lon2d = n->gridlon_221
>> hgt@lat2d = lat2d
>> hgt@lon2d = lon2d
>>
>> ; height resources
>> htres = True
>> htres@gsnDraw = False
>> htres@gsnFrame = False
>> htres@gsnAddCyclic = False
>> htres@gsnLeftString = ""
>> htres@gsnRightString = ""
>>
>>
>> clevs = ispan(498,612,6)
>>
>> htres@cnFillOn=False
>> htres@cnLinesOn=True
>> htres@cnLabelMasking = True ; does not draw line
>> behind label
>> htres@cnLineLabelBackgroundColor = -1 ; transparent
>> htres@cnLineLabelFontHeightF = 0.01
>> htres@cnLevelSelectionMode="ExplicitLevels"
>> htres@cnLevels = clevs
>> htres@cnInfoLabelOn = False
>> htres@cnSmoothingOn = True
>>
>> ;set High/Low Labels
>> htres@cnInfoLabelOn=False
>> htres@cnHighLabelsOn = True; label highs
>> htres@cnHighLabelFormat = ".3f"
>> htres@cnHighLabelPerimOn = False
>> htres@cnHighLabelFontHeightF = 0.015; larger H labels
>> htres@cnHighLabelBackgroundColor = "Transparent"
>> htres@cnLowLabelsOn = True; label lows
>> htres@cnLowLabelFormat = ".3f"
>> htres@cnLowLabelPerimOn = False
>> htres@cnLowLabelFontHeightF = 0.015; larger L labels
>> htres@cnLowLabelBackgroundColor = "Transparent"
>> htres@cnConpackParams = (/ "HLX:2, HLY:2" /)
>>
>> ;make plot
>> hgt_plot = gsn_csm_contour(wks,hgt,htres)
>> delete(htres)
>>
>> ;====================================
>> ; Control Map Resources
>>
>>
>> ; Put on Native Lambert Conic Projection and map whole NARR 221 grid
>> ;
>> mpres=True
>> mpres@gsnDraw=False
>> mpres@gsnFrame=False
>> mpres@mpProjection = "CylindricalEquidistant"
>> mpres@mpFillOn = False
>> mpres@mpLimitMode = "LatLon" ; choose range of map
>> mpres@mpMinLatF = 10.
>> mpres@mpMinLonF = -155.
>> mpres@mpMaxLatF = 60.
>> mpres@mpMaxLonF = -110.
>> mpres@mpDataBaseVersion = "MediumRes"
>> mpres@mpOutlineOn = True
>> ; mpres@mpLandFillColor = "gray"
>> mpres@mpOutlineDrawOrder = "PostDraw"
>> mpres@mpOutlineBoundarySets = "GeophysicalandUSStates" ; turn
>> on
>> state boundaries
>> mpres@tmXTOn = False
>> mpres@tmYROn = False
>> mpres@tmXBLabelFontHeightF = 0.009
>> mpres@tmYLLabelFontHeightF = 0.009 ;tick mark font
>> mpres@tmXBLabelDeltaF = -0.95 ;space between tickmark label and
>> actual tick mark
>> mpres@tmYLLabelDeltaF = -0.95
>>
>> ;titles
>> mpres@gsnStringFontHeightF = 0.011
>> mpres@gsnLeftString = "Episode "+tostring(i+1)
>> mpres@gsnLeftStringOrthogonalPosF = 0.003
>> mpres@gsnRightString = "11/28 "+time(i)+" SSMIS IWV / 1500
>> UTC
>> NARR 500 mb"
>> mpres@gsnRightStringOrthogonalPosF = 0.003
>> ; mpres@tmXBLabelFontHeightF =0.002
>> ; mpres@tmYLLabelFontHeightF =0.002
>>
>> ;make map
>> map = gsn_csm_map(wks,mpres)
>>
>> ;overlay maps
>> overlay(map,iwv_plot)
>> overlay(map,hgt_plot)
>> plots(i)=map
>> end do
>>
>> pnlres = True
>> pnlres@gsnMaximize = True
>> pnlres@gsnPanelLabelBar = True
>> pnlres@lbLabelAutoStride = False
>> pnlres@cnLabelBarEndStyle = "ExcludeOuterBoxes" ; stop ncl from
>> adding two extra boxes on label bar
>> *pnlres@lbLeftMarginF = 0 *
>> *pnlres@lbRightMarginF = 0 *
>> pnlres@lbLabelOffsetF = 0.05 ;determines amount of space
>> between
>> actual label and labelbar
>> pnlres@lbLabelStride = 3 ; skip every other label
>> pnlres@lbTitleString = "IWV (mm)"
>> pnlres@lbTitleFontHeightF = 0.0085
>> pnlres@lbTitlePosition = "Bottom"
>> pnlres@lbBoxMinorExtentF = 0.14 ; perpendicular width of labelbar
>> pnlres@lbLabelFontHeightF = 0.010
>> pnlres@pmLabelBarOrthogonalPosF = -0.01
>> *pnlres@cnInfoLabelOn = False*
>>
>> gsn_panel(wks,plots,(/2,2/),pnlres)
>>
>> end
>>
>>
>>
>> Thanks,
>>
>>
>> --
>> Arthur J. Eiserloh, Jr.
>> San Jose State University
>> Graduate Student
>> Dept. of Meteorology and Climate Science
>> -------------- next part --------------
>> An HTML attachment was scrubbed...
>> URL:
>> http://mailman.ucar.edu/pipermail/ncl-talk/attachments/20131125/f3f7200d/attachment.html
>> -------------- next part --------------
>> A non-text attachment was scrubbed...
>> Name: single_plot.png
>> Type: image/png
>> Size: 432193 bytes
>> Desc: not available
>> Url :
>> http://mailman.ucar.edu/pipermail/ncl-talk/attachments/20131125/f3f7200d/attachment.png
>> -------------- next part --------------
>> A non-text attachment was scrubbed...
>> Name: panel_plot.png
>> Type: image/png
>> Size: 785465 bytes
>> Desc: not available
>> Url :
>> http://mailman.ucar.edu/pipermail/ncl-talk/attachments/20131125/f3f7200d/attachment-0001.png
>>
>> ------------------------------
>>
>> _______________________________________________
>> ncl-talk mailing list
>> ncl-talk@ucar.edu
>> http://mailman.ucar.edu/mailman/listinfo/ncl-talk
>>
>>
>> End of ncl-talk Digest, Vol 120, Issue 41
>> *****************************************
>>
>
>
>
> _______________________________________________
> ncl-talk mailing list
> List instructions, subscriber options, unsubscribe:
> http://mailman.ucar.edu/mailman/listinfo/ncl-talk
>
_______________________________________________
ncl-talk mailing list
List instructions, subscriber options, unsubscribe:
http://mailman.ucar.edu/mailman/listinfo/ncl-talk
Received on Mon Dec 2 08:43:00 2013
This archive was generated by hypermail 2.1.8 : Wed Dec 04 2013 - 20:42:38 MST