Date: Tue Dec 03 2013 - 05:22:45 MST
Dear ncl users,
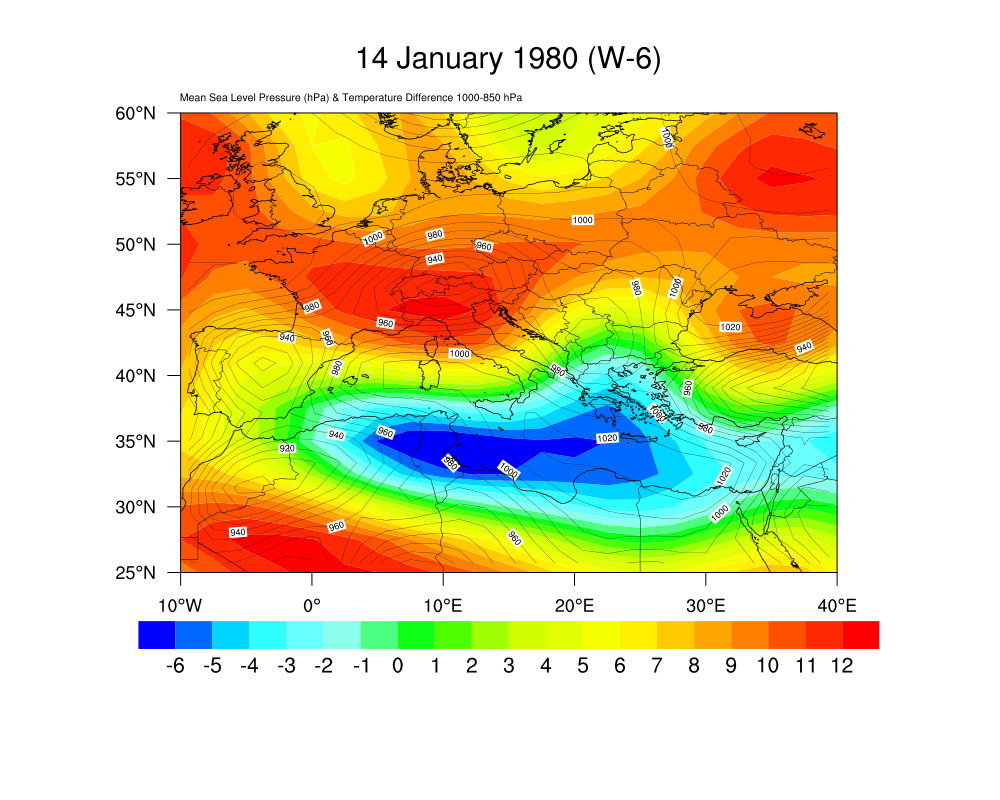
I would like to plot temperature difference between 1000-850 hPa, and over
this plot the mslp chart using the attaced script (plot_temp.ncl).
Running the script the following error messages have been appeared
warning:mpProjection is not a valid resource in Plot_contour at this time
warning:mpMinLonF is not a valid resource in Plot_contour at this time
warning:mpMaxLonF is not a valid resource in Plot_contour at this time
warning:mpMinLatF is not a valid resource in Plot_contour at this time
warning:mpMaxLatF is not a valid resource in Plot_contour at this time
warning:mpFillOn is not a valid resource in Plot_contour at this time
warning:mpDataBaseVersion is not a valid resource in Plot_contour at this
time
warning:mpDataSetName is not a valid resource in Plot_contour at this time
warning:mpOutlineBoundarySets is not a valid resource in Plot_contour at
this time
warning:mpGeophysicalLineThicknessF is not a valid resource in Plot_contour
at this time
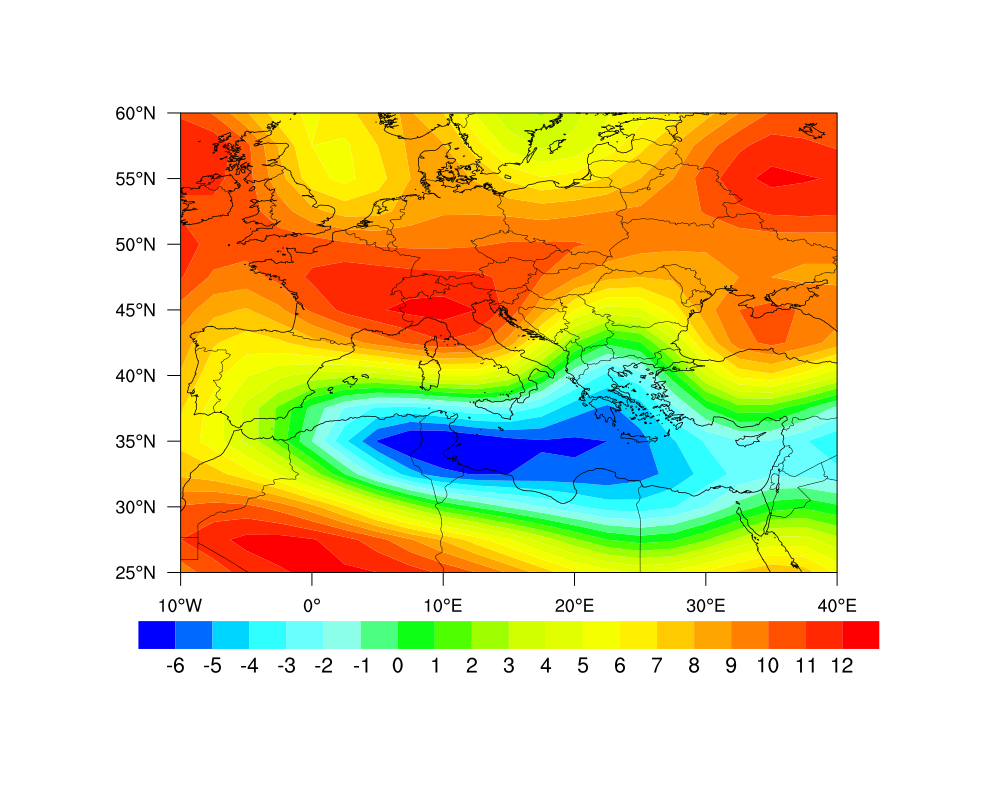
Moreover, two plots are created, but only the second plot is right (attached
png files)..
When I changed the 84th line of the script, I had got the error message
fatal:NhlAddOverlay: plot class mapPlotClass cannot be overlay plot member
I have already read the given examples at ncl web pages, but I couldn't find
any solution..
Have you got any idea????
Thanks in advance
Ioannis
_______________________________________________
ncl-talk mailing list
List instructions, subscriber options, unsubscribe:
http://mailman.ucar.edu/mailman/listinfo/ncl-talk
- application/octet-stream attachment: plot_temp.ncl
- application/octet-stream attachment: 14011980_850temp.nc
- application/octet-stream attachment: 14011980_1000temp.nc
- application/octet-stream attachment: 14011980_mslp.nc