Dave,
Please see example 3 at:
http://www.ncl.ucar.edu/Applications/ice.shtml
for examples of plotting your data using 2D lat/lon arrays, and
not having to regrid them. Of particular note are the lines:
hi_at_lon2d = lon2d
hi_at_lat2d = lat2d
which you will need in your code.
You should be able to use the same method for a Cylindrical
Equidistant projection.
--Mary
On Mon, 7 May 2007, Dave Allured wrote:
> Hello NCL.
>
> The NARR data set is pre-projected onto a Lambert conformal projection. I
> would like to plot this data onto a plain old cylindrical equidistant
> projection.
>
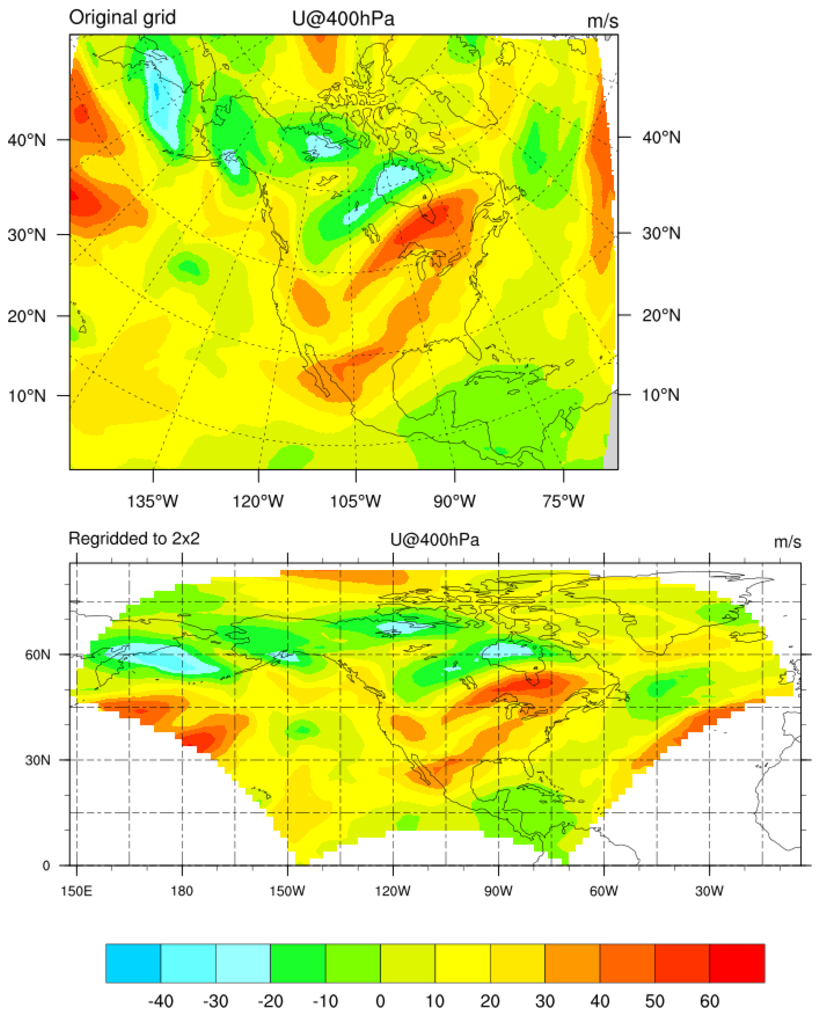
> Something like this is shown in NCL example narr_3.ncl, lower plot:
> http://www.ncl.ucar.edu/Applications/Images/narr_3_lg.png
>
> However, this example regrids the data. I would like to plot without
> regridding, to maintain full image resolution.
>
> What is the best NCL method for this? Mesh plots come to mind, but I don't
> have any experience with them. Any advice would be appreciated.
>
> --Dave A.
> CU/CIRES Climate Diagnostics Center (CDC)
> NOAA/ESRL/PSD, Climate Analysis Branch (CAB)
> _______________________________________________
> ncl-talk mailing list
> ncl-talk_at_ucar.edu
> http://mailman.ucar.edu/mailman/listinfo/ncl-talk
>
_______________________________________________
ncl-talk mailing list
ncl-talk_at_ucar.edu
http://mailman.ucar.edu/mailman/listinfo/ncl-talk
Received on Tue May 08 2007 - 09:53:46 MDT
This archive was generated by hypermail 2.2.0 : Tue May 08 2007 - 09:54:33 MDT