Date: Mon Feb 08 2010 - 10:26:17 MST
Hi NCL users,
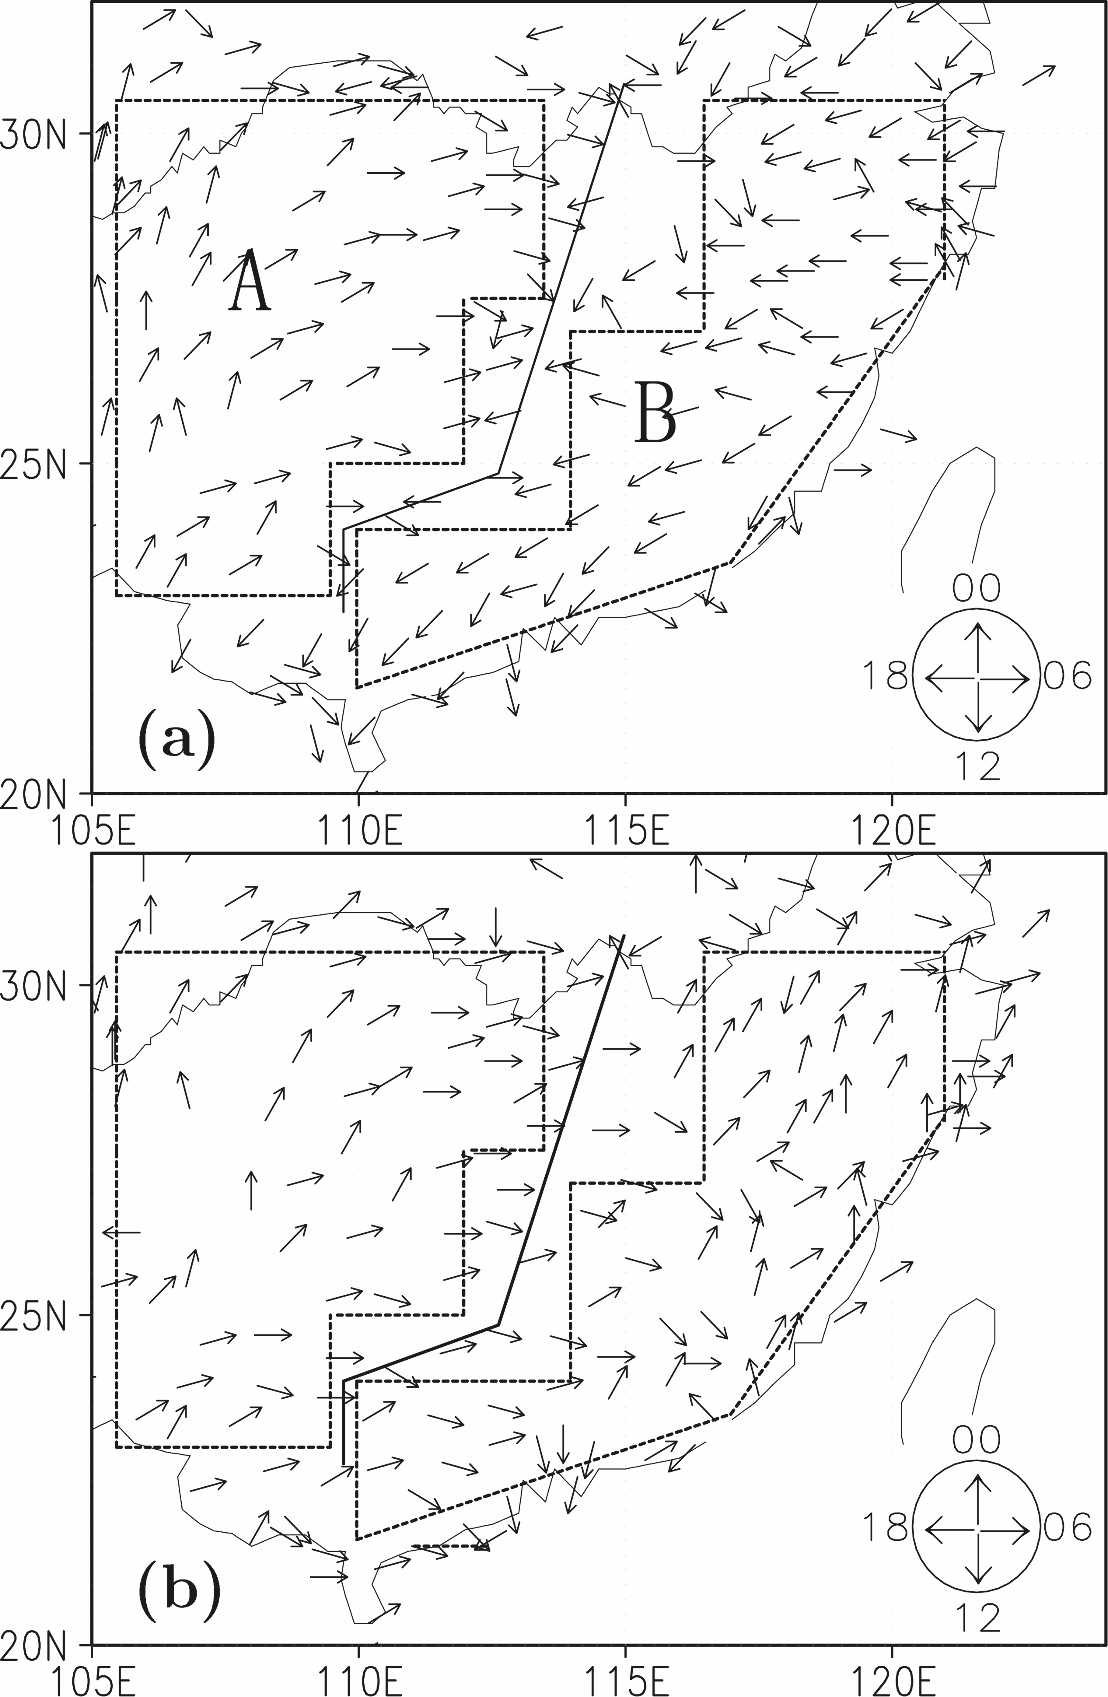
I am trying to add arrows and circle as shown in the attached figure.
These vectors are used to depict diurnal cycle following clockwise.
Unfortunately, I have some problem.
Any help is appreciable.
Here attached part of the script I used.
Thanks
wks = gsn_open_wks("eps", "panel_vector_mean_025_235K") ; open a ps file
gsn_define_colormap(wks, "BlAqGrYeOrRevi200") ; choose color map
plot = new(4, graphic) ; create a plot array
res = True ; plot mods desired
res@gsnDraw = False ; don't draw
res@gsnFrame = False ; don't advance frame
res@mpPerimOn = True
res@mpFillOn = False ; turn off map fill
res@mpDataBaseVersion = "Ncarg4_1" ; use finer database
res@pmTickMarkDisplayMode = "Always" ; turn on tickmarks
res@mpGeophysicalLineThicknessF = 2.5 ; thickness of outlines
res@mpNationalLineThicknessF = 2.5
res@mpOutlineBoundarySets = "National" ; turn on country boundaries
res@gsnAddCyclic = False ; regional data, don't add pt
res@mpMinLonF = min(lon) ; select a subregion
res@mpMaxLonF = max(lon)
res@mpMinLatF = min(lat)
res@mpMaxLatF = max(lat)
res@cnFillOn = True ; turn on color for contours
res@cnLinesOn = False ; turn off contour lines
res@cnLineLabelsOn = False ; turn off contour line labels
res@gsnScalarContour = True ; contours desired
res@gsnSpreadColors = True ; use full color map
res@gsnSpreadColorStart = 25 ; start at color 17
res@gsnSpreadColorEnd = 180 ; end at color 200
res@lbLabelBarOn = False
res@lbOrientation = "vertical" ; vertical label bar
res@pmLabelBarOrthogonalPosF = -0.01 ; move label bar closer
; res@lbLabelStride = 4
res@pmLabelBarOrthogonalPosF = 0.01
res@pmLabelBarOrthogonalPosF = -0.05
res@pmLabelBarOrthogonalPosF = 0.05
res@cnLevelSelectionMode = "ManualLevels" ; set manual contour levels
res@cnMinLevelValF = 2 ; set min contour level
res@cnMaxLevelValF = 24 ; set max contour level
res@cnLevelSpacingF = 2 ; contour spacing
res@vcRefAnnoOrthogonalPosF = -1.0 ; move ref vector up
res@vcRefMagnitudeF = 20.0 ; define vector ref mag
res@vcRefLengthF = 0.035 ; define length of vec ref
; res@vcGlyphStyle = "CurlyVector" ; turn on curly vectors
res@vcMinDistanceF = 0.015
res@gsnAddCyclic = False
res@gsnLeftString = "b)" ; add the gsn titles
res@gsnCenterString = " "
res@gsnRightString = "JJA"
res@gsnStringFont = " " ; set gsnLeft/Center/RightString font
; to helvetica-bold from default.
res@gsnLeftStringFontHeightF = 0.025 ; instead of using txFontHeightF or gsnStringFontHeightF
res@gsnCenterStringFontHeightF = 0.00 ; to set the gsnLeft/Center/RightString font heights,
res@gsnRightStringFontHeightF = 0.025 ; individually set each string's font height.
res@vpXF = 0.1
res@vpWidthF = 0.725
res@vpYF = 0.9
res@vpHeightF = 0.8
res@tmXBLabelFontHeightF = 0.02
res@tmBorderThicknessF = 3.0
res@vpXF = 0.2
res@vpWidthF = 0.6
res@vpYF = 0.83
res@vpHeightF = 0.465
res@gsnRightString = " "
res@gsnLeftString = " "
res@vcRefAnnoOn = False
plot(0) = gsn_csm_vector_scalar_map_ce(wks, u1, v1, fc1, res)
plot(1) = gsn_csm_vector_scalar_map_ce(wks, u2, v2, fc2, res)
plot(2) = gsn_csm_vector_scalar_map_ce(wks, u3, v3, fc3, res)
res@vcRefAnnoOn = True
plot(3) = gsn_csm_vector_scalar_map_ce(wks, u4, v4, fc4, res)
;************************************************
; create panel
;************************************************
resP = True ; modify the panel plot
resP@gsnFrame = False ; don't advance panel plot
resP@gsnPanelLabelBar = True ; add common colorbar
resP@gsnMaximize = True
resP@lbOrientation = "vertical"
resP@lbLabelFontHeightF = 0.015
resPgsnPanelYWhiteSpacePercent = 5
resP@cnFillOn = True ; turn on color
resP@txString = " "
resP@tiXAxisString = " "
resP@tiYAxisString = " "
resP@gsnPanelBottom = 0.05 ; add space at bottom
resP@gsnPanelFigureStrings = (/"DJF", "MAM", "JJA", "SON"/) ; add strings to panel
resP@amJust = "TopLeft"
resP@gsnPanelFigureStringsFontHeightF = 0.015
resP@gsnPanelFigureStringsPerimOn = False
gsn_panel(wks, plot, (/2, 2/), resP) ; now draw as one plot
resP@vpXF = 0.095
resP@vpYF = 0.85
resP@vpHeightF = 0.9 ; Make this second map smaller.
resP@vpWidthF = 0.9
xtres = True
xtres@txFontHeightF = 0.025
xtres@txAngleF = 0.
xtres@txFontColor = "red"
xtres@txFontHeightF = 0.025
gsn_text_ndc(wks, "a)", .305, .85, xtres)
gsn_text_ndc(wks, "b)", .75, .85, xtres)
gsn_text_ndc(wks, "c)", .305, .47, xtres)
gsn_text_ndc(wks, "d)", .75, .47, xtres)
frame(wks)
_______________________________________________
ncl-talk mailing list
List instructions, subscriber options, unsubscribe:
http://mailman.ucar.edu/mailman/listinfo/ncl-talk