Date: Mon May 10 2010 - 09:41:12 MDT
Dear NCL,
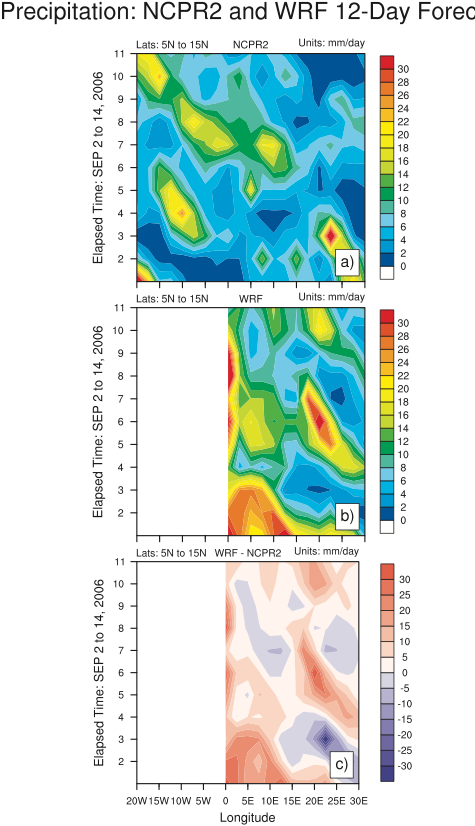
I am using the areahi2lores function to plot hi-res & lo-res
precipitation data onto the same grid. Then I create a panel plot of
each data set (2 time vs. longitude plots along with a difference
plot).
My plots will not "plot" past the prime meridian (see picture).
Both of my datasets "should" be plotting past this point since they
contain data at all of these points.
I am using the lonFlip command in my script so I don't think this is
my problem. Could there be something else causing this?
(I'm not trying to ask others to debug my program; helpful suggestions
would be nice.)
Thank you in advance.
Sincerely,
Erik Noble
_______________________________________________
ncl-talk mailing list
List instructions, subscriber options, unsubscribe:
http://mailman.ucar.edu/mailman/listinfo/ncl-talk
- text/plain attachment: terminal_history.txt
- text/plain attachment: wrf_R2_hovmoller-readNetcdf_Panel_plot-Method1_abc__Autosaved_.txt