Date: Wed Apr 13 2011 - 04:42:31 MDT
hello ncl users,
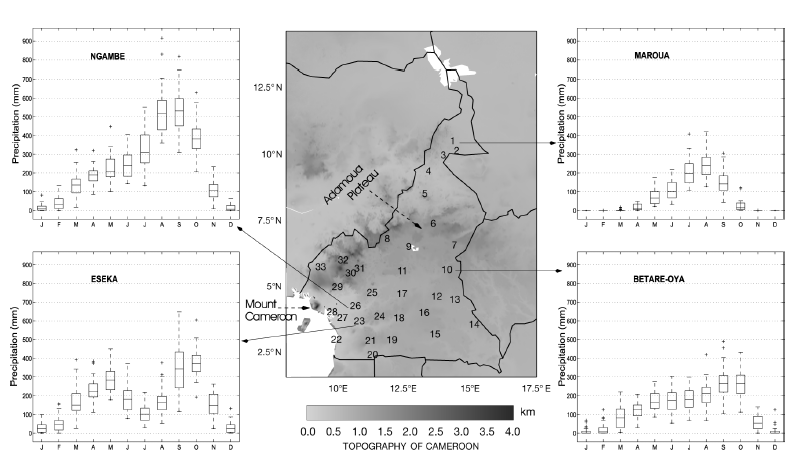
I am trying to reproduce a figure such the one I attached.
To proceed, I am using example 9 of histogram http://www.ncl.ucar.edu/Applications/histo.shtml.
But I don't know how to put the histogram exactly ouside of the map.
The histogram can be substituted by a xy plot?
Regards
_______________________________________________
ncl-talk mailing list
List instructions, subscriber options, unsubscribe:
http://mailman.ucar.edu/mailman/listinfo/ncl-talk