Date: Fri Feb 03 2012 - 01:07:22 MST
Supose that I have three colum data such as below:
time U_M U
| 1 | 7.216151 | 9.8 |
| 2 | ˇˇ | 10.5 |
| 3 | 9.295473 | 8.4 |
| 4 | ˇˇ | 8.9 |
| 5 | 9.411055 | 8.5 |
| 6 | 9.293616 | ˇˇ |
| 7 | 9.138997 | 8.6 |
| 8 | 8.930552 | 7.4 |
| 9 | 8.597112 | 5.4 |
| 10 | 8.098866 | 6.7 |
| 11 | 6.489672 | ˇˇ |
| 12 | 6.111356 | 5.2 |
| 13 | ˇˇ | 3.1 |
| 14 | 5.382022 | 3.9 |
| 15 | 4.988408 | 3.3 |
you can see that some data is missing.
how can i write the command to caculate the average value of U_M ?
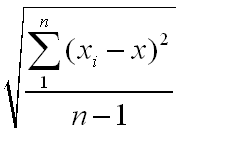
and the standard deviation
and the related coefficient of U_M ?
it is the same to U.
further on how can i write the command to caculate the t when a is 0.05?
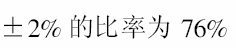
how can i caculate the portfolio concentration such as 2% is 76%?
thank you very much!
_______________________________________________
ncl-talk mailing list
List instructions, subscriber options, unsubscribe:
http://mailman.ucar.edu/mailman/listinfo/ncl-talk