Date: Fri Apr 06 2012 - 05:53:11 MDT
Dear all,
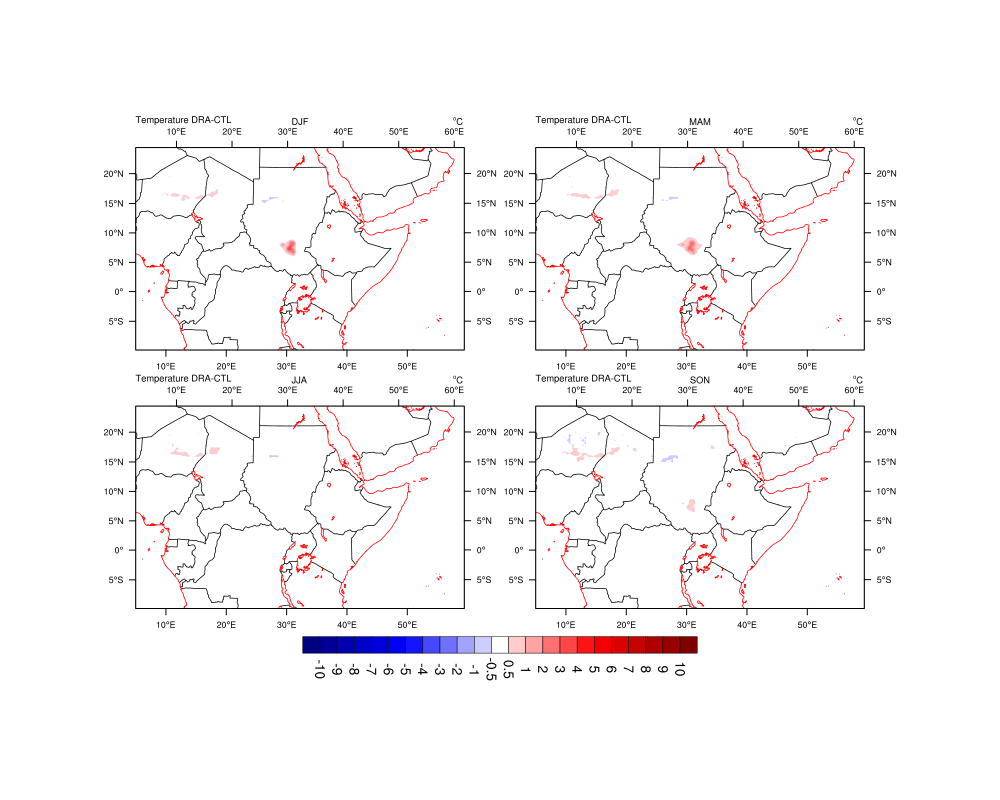
I want to plot my data on a specific area, so what can do in my script to do this.
note that the iy and jx are not the ordinary lat lon but they are in Kilometers the ncdump for my file is attached
I attached the ncl script, ncdump file and the output image of my whole domain.
thanks
Ā
Mohamed Ibrahim El-Sayed OMAR
Egyptian Meteorological Authority
Scientific Research Department
Climate Studies Centre
Kobry El-Quobba, P.O.Box. 11784
Cairo, EGYPT
Mobil phoneĀ : 002 0160802805Ā
Home Phone : 002 0482370261
_______________________________________________
ncl-talk mailing list
List instructions, subscriber options, unsubscribe:
http://mailman.ucar.edu/mailman/listinfo/ncl-talk