Hi:
I posted the issue two days ago. Perhaps I didn't describe it well. I have not received any response. So I repost it here. Sorry!
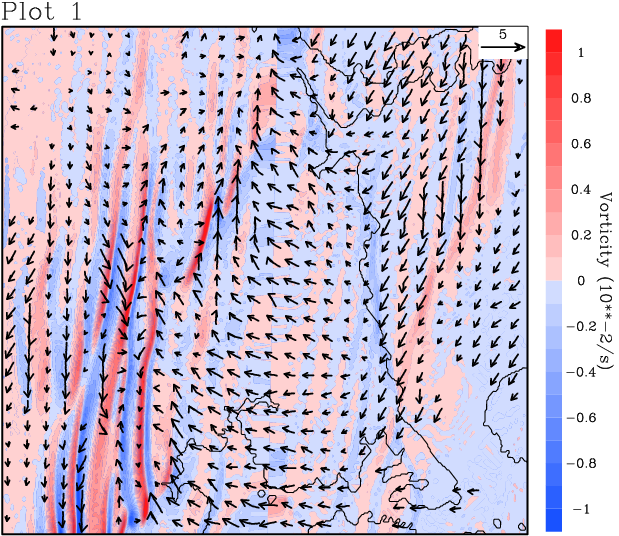
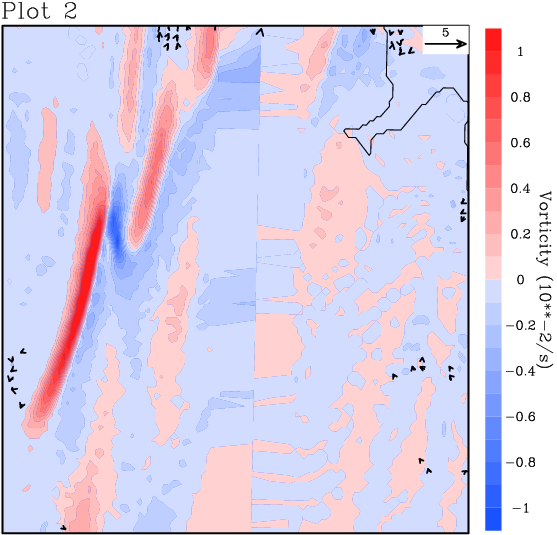
I used the same ncl codes to plot wind vectors in an area (~30x30km) and a sub-area (~10x10km) of it. The only differences are the parameters controlling the area to plot. However, the wind vectors can be plotted for the large area (this means my data are OK) but not on the sub-area. Can anyone help me fix the problem?
plot_1.png was plotted by plot_1.ncl for the large area. plot_2.png was plotted for the sub-area by plot_2.ncl.The resolution of the data is 100m.
Thank you very much!
Ed
--- On Wed, 7/4/12, Yang Yang <yang123yang@yahoo.com> wrote:
> From: Yang Yang <yang123yang@yahoo.com>
> Subject: Odd plot of wind vectors
> To: ncl-talk@ucar.edu
> Date: Wednesday, July 4, 2012, 8:14 AM
> Hi:
>
> I have a regional model output (100m resolution). When I
> ploted an area about 30x30km (plot_1.png attached) using
> plot_1.ncl, the plot seems OK. However, when I tried to plot
> an area about 10x10km within the 30x30km area, the plotted
> wind vectors are quite odd (plot_2.png by plot_2.ncl), and
> wind vectors were not plotted in most areas. Can anyone help
> me fix the problem? Thanks!
>
> Ed
> -----Inline Attachment Follows-----
>
> _______________________________________________
> ncl-talk mailing list
> List instructions, subscriber options, unsubscribe:
> http://mailman.ucar.edu/mailman/listinfo/ncl-talk
>
_______________________________________________
ncl-talk mailing list
List instructions, subscriber options, unsubscribe:
http://mailman.ucar.edu/mailman/listinfo/ncl-talk
This archive was generated by hypermail 2.1.8 : Mon Jul 09 2012 - 10:45:32 MDT