Hi Mary:
Thank you very much for your help!
I read the required data and wrote them to a nc file.
Attached please find the compressed data file, the ncl codes, and the pictures.
Please let me know if you have any problems to read the data.
Cheers!
Ed
--- On Tue, 7/10/12, Mary Haley <haley@ucar.edu> wrote:
> From: Mary Haley <haley@ucar.edu>
> Subject: Re: Why wind vectors could not be plotted in a sub-area with the same ncl codes?
> To: "Yang Yang" <yang123yang@yahoo.com>
> Cc: "Dennis Shea" <shea@ucar.edu>
> Date: Tuesday, July 10, 2012, 1:22 AM
> Hi,
>
> Still no luck:
>
> -rw-rw-r-- 1 haley CIT\Domain Users
> 203812153 Jul 9 11:19 test.nc.gz
>
> I think the file is getting truncated every time you upload
> it. Do you have some place else you can put it,
> or can you try making it smaller? Perhaps you can write only
> the variables needed for plotting to another file?
>
> --Mary
>
>
> On Jul 8, 2012, at 3:40 PM, Yang Yang wrote:
>
> > Hi Mary and Dennis:
> >
> > Thank you very much for your help. I checked the
> compressed file again and had the same problem as yours.
> Sorry for the problem.
> >
> > I recompressed the file, which should be right this
> time.
> >
> > yangy@thotter:TEMP/ $ ls -il test.nc.gz
> > 3785158064 -rw-r--r-- 1 yangy niwa-users 308594775
> 2012-07-09 09:14 test.nc.gz
> >
> > I ftped the file again. If you cannot find a file named
> test.nc.gz or the file size is different, would you please
> let me know? This file is exactly the same file I used to
> plot.
> >
> > Cheers!
> >
> > Ed
> > --- On Fri, 7/6/12, Mary Haley <haley@ucar.edu>
> wrote:
> >
> >> From: Mary Haley <haley@ucar.edu>
> >> Subject: Re: Why wind vectors could not
> be plotted in a sub-area with the same ncl codes?
> >> To: "Yang Yang" <yang123yang@yahoo.com>
> >> Cc: "Dennis Shea" <shea@ucar.edu>
> >> Date: Friday, July 6, 2012, 10:08 PM
> >> Dear Ed,
> >>
> >> I downloaded your file, but when I tried to unzip
> it, I got
> >> the error:
> >>
> >> % gunzip xadala_pi00002011050215_utc.nc.gz
> >>
> >> gzip: xadala_pi00002011050215_utc.nc.gz: unexpected
> end of
> >> file
> >>
> >> The file is 205103998 bytes. Can you
> double-check that
> >> the file is valid on your end, and put it on
> >> anonymous ftp again if possible?
> >>
> >> Thanks,
> >>
> >> --Mary
> >>
> >> On Jul 5, 2012, at 10:57 PM, Yang Yang wrote:
> >>
> >>> Hi Dennis:
> >>>
> >>> Thanks for your help.
> >>>
> >>> I have ftped the file to the specified
> directory. It is
> >> a compressed file:
> xadala_pi00002011050215_utc.nc.gz
> >>>
> >>> Would you please let me know if you cannot find
> the
> >> file? Thanks!
> >>>
> >>> Ed
> >>>
> >>> --- On Fri, 7/6/12, Dennis Shea <shea@ucar.edu>
> >> wrote:
> >>>
> >>>> From: Dennis Shea <shea@ucar.edu>
> >>>> Subject: Re: Why wind vectors
> could not
> >> be plotted in a sub-area with the same ncl codes?
> >>>> To: "Yang Yang" <yang123yang@yahoo.com>
> >>>> Cc: ncl-talk@ucar.edu
> >>>> Date: Friday, July 6, 2012, 7:22 AM
> >>>> Nothing obviously wrong see 'diff'
> >>>> below'.
> >>>>
> >>>>
> >>>> It might be best to send the file to:
> >>>>
> >>>> ftp ftp.cgd.ucar.edu
> >>>> anonymous
> >>>> <use your email address for the
> password>
> >>>> cd incoming
> >>>> put xadala_pi00002011050215_utc.nc
> >>>> quit
> >>>>
> >>>> Send email to ncl-talk
> >>>> after you have successfully completed the
> >> transfer.
> >>>>
> >>>> ================================
> >>>> Rather than a double do loop
> >>>>
> >>>> do i=100, 500
> >>>> do j=100, 500
> >>>>
> >>>>
> xx=(v10m(i,j+1)-v10m(i,j-1))/200.
> >>>>
> >>>>
> yy=(u10m(i+1,j)-u10m(i-1,j))/200.
> >>>> vor(i,j)=xx-yy
> >>>> end do
> >>>> end do
> >>>>
> >>>> Why not use the builtin func
> >>>> dd = 200.0
> >>>> xx =
> >> center_finite_diff_n
> >>>> (v10m,200,False,0, 1)
> >>>> yy =
> >> center_finite_diff_n
> >>>> (u10m,200,False,0, 0)
> >>>> vor = xx-yy
> >>>> ================================
> >>>> %> diff plot_1.ncl plot_2.ncl
> >>>>
> >>>> 91c91
> >>>> <
> res1@gsnLeftString =
> >> "Plot_1 "
> >>>> ---
> >>>>>
> res1@gsnLeftString =
> >> "Plot_2 "
> >>>> 129c129
> >>>> < wks =
> gsn_open_wks
> >>>> ("eps","plot_1")
> ; open
> >>>> workstation
> >>>> ---
> >>>>> wks =
> gsn_open_wks
> >>>> ("eps","plot_2")
> ; open
> >>>> workstation
> >>>> 139,142c139,142
> >>>>
> >>
> < res1@mpLeftCornerLatF
> >>>> = -36.85
> >>>>
> >>
> < res1@mpLeftCornerLonF
> >>>> = 174.54
> >>>>
> >>
> < res1@mpRightCornerLatF
> >>>> = -36.6
> >>>>
> >>
> < res1@mpRightCornerLonF
> >>>> = 174.85
> >>>> ---
> >>>>>
> >> res1@mpLeftCornerLatF
> >>>> = -36.75
> >>>>>
> >> res1@mpLeftCornerLonF
> >>>> = 174.64
> >>>>>
> >> res1@mpRightCornerLatF
> >>>> = -36.65
> >>>>>
> >> res1@mpRightCornerLonF
> >>>> = 174.75
> >>>> 149c149
> >>>> < inc = 10
> >>
> >>>>
>
> >> ;
> >>>> plot at every "inc" grid point
> >>>> ---
> >>>>> inc = 2
>
> >>
> >>>>
>
> >> ;
> >>>> plot at every "inc" grid point
> >>>> =================================
> >>>>
> >>>>
> >>>> On 7/5/12 3:44 PM, Yang Yang wrote:
> >>>>> Hi:
> >>>>>
> >>>>> I posted the issue two days ago.
> Perhaps I
> >> didn't
> >>>> describe it well. I have not received any
> response.
> >> So I
> >>>> repost it here. Sorry!
> >>>>>
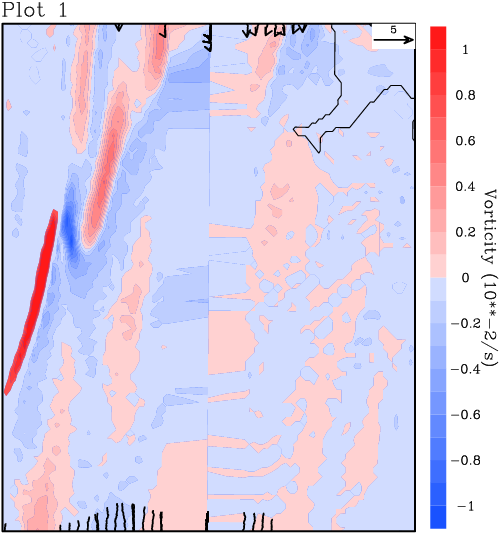
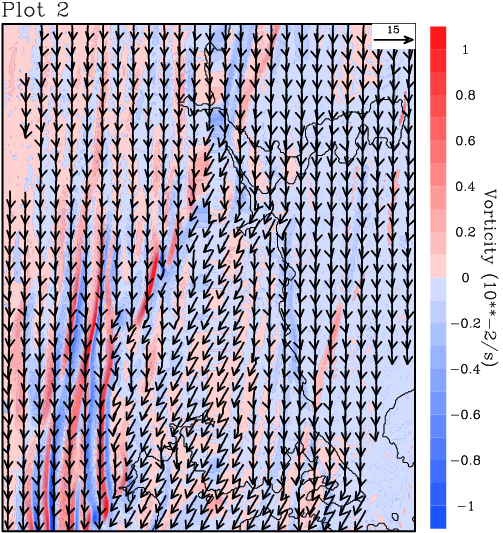
> >>>>> I used the same ncl codes to plot wind
> vectors
> >> in an
> >>>> area (~30x30km) and a sub-area (~10x10km)
> of it.
> >> The only
> >>>> differences are the parameters controlling
> the area
> >> to plot.
> >>>> However, the wind vectors can be plotted
> for the
> >> large area
> >>>> (this means my data are OK) but not on the
> >> sub-area. Can
> >>>> anyone help me fix the problem?
> >>>>>
> >>>>> plot_1.png was plotted by plot_1.ncl
> for the
> >> large
> >>>> area. plot_2.png was plotted for the
> sub-area by
> >>>> plot_2.ncl.The resolution of the data is
> 100m.
> >>>>>
> >>>>> Thank you very much!
> >>>>>
> >>>>> Ed
> >>>>>
> >>>>> --- On Wed, 7/4/12, Yang Yang<yang123yang@yahoo.com>
> >>
> >>>> wrote:
> >>>>>
> >>>>>> From: Yang Yang<yang123yang@yahoo.com>
> >>>>>> Subject: Odd plot of
> wind
> >> vectors
> >>>>>> To: ncl-talk@ucar.edu
> >>>>>> Date: Wednesday, July 4, 2012, 8:14
> AM
> >>>>>> Hi:
> >>>>>>
> >>>>>> I have a regional model output
> (100m
> >> resolution).
> >>>> When I
> >>>>>> ploted an area about 30x30km
> (plot_1.png
> >> attached)
> >>>> using
> >>>>>> plot_1.ncl, the plot seems OK.
> However,
> >> when I
> >>>> tried to plot
> >>>>>> an area about 10x10km within the
> 30x30km
> >> area, the
> >>>> plotted
> >>>>>> wind vectors are quite odd
> (plot_2.png by
> >>>> plot_2.ncl), and
> >>>>>> wind vectors were not plotted in
> most
> >> areas. Can
> >>>> anyone help
> >>>>>> me fix the problem? Thanks!
> >>>>>>
> >>>>>> Ed
> >>>>>> -----Inline Attachment
> Follows-----
> >>>>>>
> >>>>>>
> >> _______________________________________________
> >>>>>> ncl-talk mailing list
> >>>>>> List instructions, subscriber
> options,
> >>>> unsubscribe:
> >>>>>> http://mailman.ucar.edu/mailman/listinfo/ncl-talk
> >>>>>>
> >>>>>>
> >>>>>>
> >> _______________________________________________
> >>>>>> ncl-talk mailing list
> >>>>>> List instructions, subscriber
> options,
> >>>> unsubscribe:
> >>>>>> http://mailman.ucar.edu/mailman/listinfo/ncl-talk
> >>>>
> >>>
> _______________________________________________
> >>> ncl-talk mailing list
> >>> List instructions, subscriber options,
> unsubscribe:
> >>> http://mailman.ucar.edu/mailman/listinfo/ncl-talk
> >>
> >>
>
>
This archive was generated by hypermail 2.1.8 : Thu Jul 12 2012 - 10:16:50 MDT