Hi Mary:
I have sent you my data via the previous email. Attached please find the two pics plotted by the two ncl codes.
Please let me know if you have not received the data.
Cheers!
Ed
--- On Tue, 7/10/12, Mary Haley <haley@ucar.edu> wrote:
> From: Mary Haley <haley@ucar.edu>
> Subject: Re: Why wind vectors could not be plotted in a sub-area with the same ncl codes?
> To: "Yang Yang" <yang123yang@yahoo.com>
> Cc: "Dennis Shea" <shea@ucar.edu>
> Date: Tuesday, July 10, 2012, 1:22 AM
> Hi,
>
> Still no luck:
>
> -rw-rw-r--Ā 1 haleyĀ CIT\Domain UsersĀ
> 203812153 JulĀ 9 11:19 test.nc.gz
>
> I think the file is getting truncated every time you upload
> it. Do you have some place else you can put it,
> or can you try making it smaller? Perhaps you can write only
> the variables needed for plotting to another file?
>
> --Mary
>
>
> On Jul 8, 2012, at 3:40 PM, Yang Yang wrote:
>
> > Hi Mary and Dennis:
> >
> > Thank you very much for your help. I checked the
> compressed file again and had the same problem as yours.
> Sorry for the problem.
> >
> > I recompressed the file, which should be right this
> time.
> >
> > yangy@thotter:TEMP/ $ ls -il test.nc.gz
> > 3785158064 -rw-r--r-- 1 yangy niwa-users 308594775
> 2012-07-09 09:14 test.nc.gz
> >
> > I ftped the file again. If you cannot find a file named
> test.nc.gz or the file size is different, would you please
> let me know? This file is exactly the same file I used to
> plot.
> >
> > Cheers!
> >
> > Ed
> > --- On Fri, 7/6/12, Mary Haley <haley@ucar.edu>
> wrote:
> >
> >> From: Mary Haley <haley@ucar.edu>
> >> Subject: Re: Why wind vectors could not
> be plotted in a sub-area with the same ncl codes?
> >> To: "Yang Yang" <yang123yang@yahoo.com>
> >> Cc: "Dennis Shea" <shea@ucar.edu>
> >> Date: Friday, July 6, 2012, 10:08 PM
> >> Dear Ed,
> >>
> >> I downloaded your file, but when I tried to unzip
> it, I got
> >> the error:
> >>
> >> % gunzip xadala_pi00002011050215_utc.nc.gz
> >>
> >> gzip: xadala_pi00002011050215_utc.nc.gz: unexpected
> end of
> >> file
> >>
> >> The file is 205103998 bytes.Ā Can you
> double-check that
> >> the file is valid on your end, and put it on
> >> anonymous ftp again if possible?
> >>
> >> Thanks,
> >>
> >> --Mary
> >>
> >> On Jul 5, 2012, at 10:57 PM, Yang Yang wrote:
> >>
> >>> Hi Dennis:
> >>>
> >>> Thanks for your help.
> >>>
> >>> I have ftped the file to the specified
> directory. It is
> >> a compressed file:
> xadala_pi00002011050215_utc.nc.gz
> >>>
> >>> Would you please let me know if you cannot find
> the
> >> file? Thanks!
> >>>
> >>> Ed
> >>>
> >>> --- On Fri, 7/6/12, Dennis Shea <shea@ucar.edu>
> >> wrote:
> >>>
> >>>> From: Dennis Shea <shea@ucar.edu>
> >>>> Subject: Re: Why wind vectors
> could not
> >> be plotted in a sub-area with the same ncl codes?
> >>>> To: "Yang Yang" <yang123yang@yahoo.com>
> >>>> Cc: ncl-talk@ucar.edu
> >>>> Date: Friday, July 6, 2012, 7:22 AM
> >>>> Nothing obviously wrong see 'diff'
> >>>> below'.
> >>>>
> >>>>
> >>>> It might be best to send the file to:
> >>>>
> >>>> ftp ftp.cgd.ucar.edu
> >>>> anonymous
> >>>> <use your email address for the
> password>
> >>>> cd incoming
> >>>> put xadala_pi00002011050215_utc.nc
> >>>> quit
> >>>>
> >>>> Send email to ncl-talk
> >>>> after you have successfully completed the
> >> transfer.
> >>>>
> >>>> ================================
> >>>> Rather than a double do loop
> >>>>
> >>>>Ā Ā Ā do i=100, 500
> >>>>Ā Ā Ā do j=100, 500
> >>>>Ā ĀĀĀ
> >>>>Ā
> ĀĀĀxx=(v10m(i,j+1)-v10m(i,j-1))/200.
> >>>>Ā ĀĀĀ
> >>>>Ā
> ĀĀĀyy=(u10m(i+1,j)-u10m(i-1,j))/200.
> >>>>Ā Ā Ā vor(i,j)=xx-yy
> >>>>Ā Ā Ā end do
> >>>>Ā Ā Ā end do
> >>>>
> >>>> Why not use the builtin func
> >>>>Ā Ā Ā ddĀ = 200.0
> >>>>Ā Ā Ā xxĀ =
> >> center_finite_diff_n
> >>>> (v10m,200,False,0, 1)
> >>>>Ā Ā Ā yyĀ =
> >> center_finite_diff_n
> >>>> (u10m,200,False,0, 0)
> >>>>Ā Ā Ā vor = xx-yy
> >>>> ================================
> >>>> %> diff plot_1.ncl plot_2.ncl
> >>>>
> >>>> 91c91
> >>>> <Ā
> ĀĀĀres1@gsnLeftString =
> >> "Plot_1 "
> >>>> ---
> >>>>>Ā Ā
> ĀĀĀres1@gsnLeftString =
> >> "Plot_2 "
> >>>> 129c129
> >>>> <Ā ĀĀĀwks =
> gsn_open_wks
> >>>> ("eps","plot_1")Ā Ā Ā Ā
> ; open
> >>>> workstation
> >>>> ---
> >>>>>Ā Ā ĀĀĀwks =
> gsn_open_wks
> >>>> ("eps","plot_2")Ā Ā Ā Ā
> ; open
> >>>> workstation
> >>>> 139,142c139,142
> >>>>
> >>
> <ĀĀĀres1@mpLeftCornerLatFĀĀĀ
> >>>>Ā ĀĀĀ= -36.85
> >>>>
> >>
> <ĀĀĀres1@mpLeftCornerLonFĀĀĀ
> >>>>Ā ĀĀĀ= 174.54
> >>>>
> >>
> <ĀĀĀres1@mpRightCornerLatFĀĀĀ
> >>>>Ā Ā = -36.6
> >>>>
> >>
> <ĀĀĀres1@mpRightCornerLonFĀĀĀ
> >>>>Ā Ā = 174.85
> >>>> ---
> >>>>>Ā Ā
> >> res1@mpLeftCornerLatFĀĀĀ
> >>>>Ā ĀĀĀ= -36.75
> >>>>>Ā Ā
> >> res1@mpLeftCornerLonFĀĀĀ
> >>>>Ā ĀĀĀ= 174.64
> >>>>>Ā Ā
> >> res1@mpRightCornerLatFĀĀĀ
> >>>>Ā Ā = -36.65
> >>>>>Ā Ā
> >> res1@mpRightCornerLonFĀĀĀ
> >>>>Ā Ā = 174.75
> >>>> 149c149
> >>>> <Ā ĀĀĀinc = 10
> >>Ā Ā
> >>>>Ā Ā Ā Ā Ā Ā
> Ā
> >>Ā Ā ;
> >>>> plot at every "inc" grid point
> >>>> ---
> >>>>>Ā Ā ĀĀĀinc = 2
>
> >>Ā Ā
> >>>>Ā Ā Ā Ā Ā Ā
> Ā
> >>Ā Ā ;
> >>>> plot at every "inc" grid point
> >>>> =================================
> >>>>
> >>>>
> >>>> On 7/5/12 3:44 PM, Yang Yang wrote:
> >>>>> Hi:
> >>>>>
> >>>>> I posted the issue two days ago.
> Perhaps I
> >> didn't
> >>>> describe it well. I have not received any
> response.
> >> So I
> >>>> repost it here. Sorry!
> >>>>>
> >>>>> I used the same ncl codes to plot wind
> vectors
> >> in an
> >>>> area (~30x30km) and a sub-area (~10x10km)
> of it.
> >> The only
> >>>> differences are the parameters controlling
> the area
> >> to plot.
> >>>> However, the wind vectors can be plotted
> for the
> >> large area
> >>>> (this means my data are OK) but not on the
> >> sub-area. Can
> >>>> anyone help me fix the problem?
> >>>>>
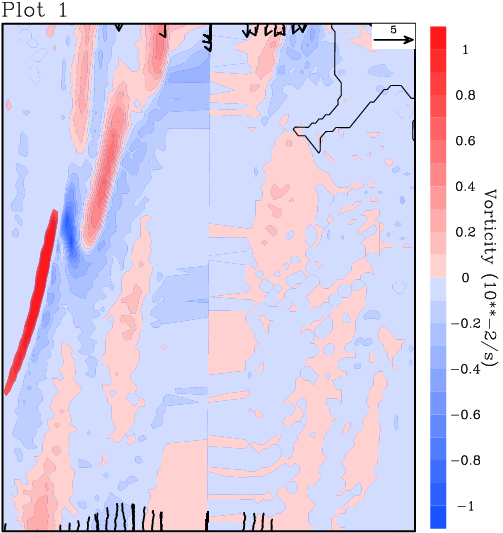
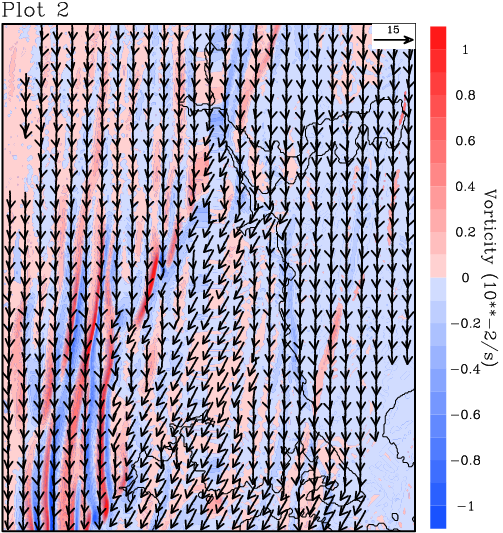
> >>>>> plot_1.png was plotted by plot_1.ncl
> for the
> >> large
> >>>> area. plot_2.png was plotted for the
> sub-area by
> >>>> plot_2.ncl.The resolution of the data is
> 100m.
> >>>>>
> >>>>> Thank you very much!
> >>>>>
> >>>>> Ed
> >>>>>
> >>>>> --- On Wed, 7/4/12, Yang Yang<yang123yang@yahoo.com>
> >>
> >>>> wrote:
> >>>>>
> >>>>>> From: Yang Yang<yang123yang@yahoo.com>
> >>>>>> Subject: Odd plot of
> wind
> >> vectors
> >>>>>> To: ncl-talk@ucar.edu
> >>>>>> Date: Wednesday, July 4, 2012, 8:14
> AM
> >>>>>> Hi:
> >>>>>>
> >>>>>> I have a regional model output
> (100m
> >> resolution).
> >>>> When I
> >>>>>> ploted an area about 30x30km
> (plot_1.png
> >> attached)
> >>>> using
> >>>>>> plot_1.ncl, the plot seems OK.
> However,
> >> when I
> >>>> tried to plot
> >>>>>> an area about 10x10km within the
> 30x30km
> >> area, the
> >>>> plotted
> >>>>>> wind vectors are quite odd
> (plot_2.png by
> >>>> plot_2.ncl), and
> >>>>>> wind vectors were not plotted in
> most
> >> areas. Can
> >>>> anyone help
> >>>>>> me fix the problem? Thanks!
> >>>>>>
> >>>>>> Ed
> >>>>>> -----Inline Attachment
> Follows-----
> >>>>>>
> >>>>>>
> >> _______________________________________________
> >>>>>> ncl-talk mailing list
> >>>>>> List instructions, subscriber
> options,
> >>>> unsubscribe:
> >>>>>> http://mailman.ucar.edu/mailman/listinfo/ncl-talk
> >>>>>>
> >>>>>>
> >>>>>>
> >> _______________________________________________
> >>>>>> ncl-talk mailing list
> >>>>>> List instructions, subscriber
> options,
> >>>> unsubscribe:
> >>>>>> http://mailman.ucar.edu/mailman/listinfo/ncl-talk
> >>>>
> >>>
> _______________________________________________
> >>> ncl-talk mailing list
> >>> List instructions, subscriber options,
> unsubscribe:
> >>> http://mailman.ucar.edu/mailman/listinfo/ncl-talk
> >>
> >>
>
>
_______________________________________________
ncl-talk mailing list
List instructions, subscriber options, unsubscribe:
http://mailman.ucar.edu/mailman/listinfo/ncl-talk
This archive was generated by hypermail 2.1.8 : Thu Jul 12 2012 - 10:16:50 MDT