Date: Tue Jul 10 2012 - 11:13:24 MDT
Hi NCL,
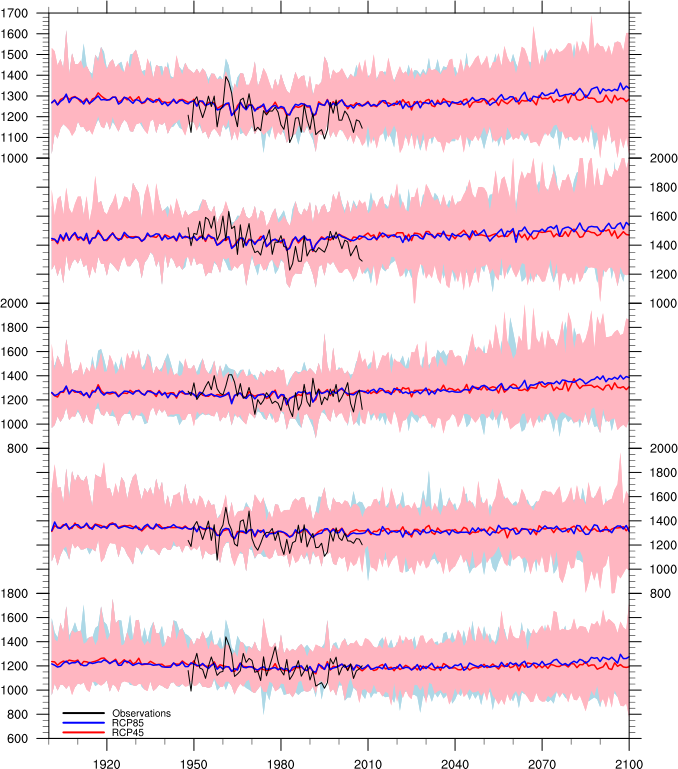
I want to add the following to a series of XY-plots attached together (plot
and section of the code attached). Each plot is created by overlaying three
plots.
(a) make the pink shade transparent so that the blue shade in the back is
also visible (I don't find any xy-plot resources to do this so far)
(b) add a gray box or vertical lines at three time-periods (1971-2000,
2021-2050 and 2070-2099) for added emphasis
Could you provide some guidance in this.
Thanks,
Noel
_______________________________________________
ncl-talk mailing list
List instructions, subscriber options, unsubscribe:
http://mailman.ucar.edu/mailman/listinfo/ncl-talk
- application/octet-stream attachment: XY_plot_attached_along_X_axis_ex.ncl