Date: Fri Jul 13 2012 - 14:59:29 MDT
Hi Kyle and Mary,
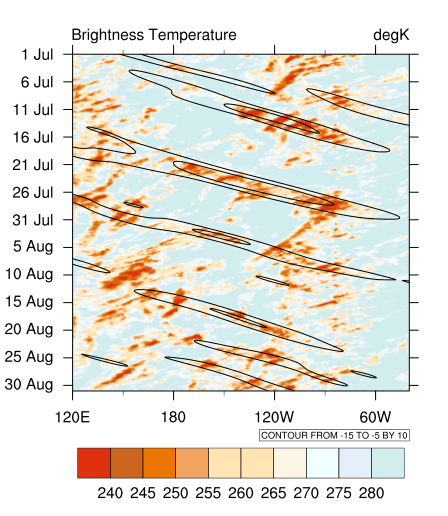
Ok, problem is solved now!
Thanks a lot Kyle for your nice suggestion.
I attached the fixed script and the plot.
Thanks,
Antonio.
On Fri, Jul 13, 2012 at 10:29 PM, Mary Haley <haley@ucar.edu> wrote:
> Hi Kyle,
>
> The cd_string.ncl not being included in V6.1.0-beta is my fault. I fixed
> this so it will be available for all binaries in 6.1.0.
>
> Meanwhile I've attached it here.
>
>
> --Mary
>
> On Jul 13, 2012, at 2:08 PM, Kyle Griffin wrote:
>
> > I'm not fully sure why time_axis_labels is not working as advertised -
> in experimenting with your original script, it does not actually set the
> tmYLLabels or tmYLValues at all, and the attributes are left undefined at
> plot time.
> >
> > To sidestep this for now, I've take your code and simulated what
> time_axis_labels would do. Instead of creating the new resource, setting
> attributes, and calling time_axis_labels, you can instead just use the
> lines:
> >
> > res@tmYLMode = "Explicit"
> > res@tmYLValues = origData&time(::40)
> > res@tmYLLabels = ut_string(origData&time(::40),"%d %c")
> >
> > where 40 and the "%d %c" format come from the script and can be changed
> as you see fit.
> >
> > This worked for me using Carl's original data (too large to include
> here) and produced the attached plot. If Carl or Arindam (or any of the NCL
> team) would like to chime in on what might be going wrong, I'd be curious
> to hear.
> >
> > Of further note, I've also noticed that cd_string.ncl was not inclue in
> the "contib" folder of either our Linux x64 or Mac OS X builds of 6.1.0
> beta, something that probably needs to be fixed in the future.
> >
> >
> > Kyle
> > -----------------------------------------------------
> > Kyle S. Griffin
> > Dept. of Atmospheric and Environmental Sciences
> > University at Albany, SUNY
> > 1400 Washington Ave, Albany, NY 12222
> > Office: ES-218 Email: kgriffin@albany.edu
> > http://www.atmos.albany.edu/student/kgriffin/
> >
> >
> >
> > On Fri, Jul 13, 2012 at 2:53 PM, antonio avio <
> antonioavio@googlemail.com> wrote:
> > Hi Kyle,
> >
> > The results is the same as before.
> > I got this warning :
> > warning:Attempt to reference attribute (nTicks) which is undefined.
> > and the time axis is still not correct.
> >
> > Antonio,
> >
> >
> > On Fri, Jul 13, 2012 at 8:22 PM, Kyle Griffin <kgriffin@albany.edu>
> wrote:
> > Hi Antonio,
> >
> > Looks like you changed more than you needed to. From your original
> script, the line
> >
> > tTick( origData&time, res, resTick )
> >
> > can simply be changed to
> >
> > time_axis_labels( origData&time, res, resTick )
> >
> > The 'res' resource that is being passed to the time_axis_labels needs to
> be the one associated with the plot you're making. In your next script, you
> create a brand new resource and give that to the procedure. If you plotted
> gsn_csm_contour with 'resPlot', you would get the axis right, but without
> the additional resources you set in 'res'.
> >
> > Key thing to remember here is that this procedure simply sets the
> tickmark resource in an already established variable. Edit the original
> script with just the one line changed and I think you should be good. If
> not, reply (and make sure to include ncl-talk) and let us know how it works.
> >
> >
> > Kyle
> > -----------------------------------------------------
> > Kyle S. Griffin
> > Dept. of Atmospheric and Environmental Sciences
> > University at Albany, SUNY
> > 1400 Washington Ave, Albany, NY 12222
> > Office: ES-218 Email: kgriffin@albany.edu
> > http://www.atmos.albany.edu/student/kgriffin/
> >
> >
> >
> > On Fri, Jul 13, 2012 at 2:16 PM, antonio avio <
> antonioavio@googlemail.com> wrote:
> > Hi Kyle,
> >
> > I have modified the script in line 105-113
> >
> > ; use tTick to set the time axis
> > resplot = True
> > restick = True
> > restick@ttFormat = "%d %c"
> > restick@ttAxis = "YL"
> > restick@ttMajorStride = 40
> > time_axis_labels( origData&time, resplot, restick )
> >
> > plot = gsn_csm_hov( wks, origData({startDate:endDate},{120:320}), res )
> >
> >
> > and its running well, but the time axis is still wrong,
> > Any suggestion,
> > thanks for your help.
> > here i attached the plot.
> >
> > Thanks alot,
> > Antonio
> >
> >
> >
> >
> > On Fri, Jul 13, 2012 at 7:39 PM, Kyle Griffin <kgriffin@albany.edu>
> wrote:
> > Hi Antonio,
> >
> > You'll notice that in the contributed scripts you load at the top of the
> file, you load a "time_axis_labels" function, which replaces the utility
> that tTick once provided. While some older versions of code still include
> tTick, it is no longer included in releases of NCL, thus leading to your
> problem.
> >
> > If you change tTick to time_axis_labels, the script should work fine.
> See:
> >
> >
> http://www.ncl.ucar.edu/Document/Functions/User_contributed/time_axis_labels.shtml
> >
> > and you'll notice the documentation to be similar to that of tTick, with
> the exact same required inputs to the procedure.
> >
> > If it doesn't, we still have an old copy of the tTick.ncl procedure
> floating around here at Albany that can be sent along for your purpose.
> >
> >
> > Kyle
> > -----------------------------------------------------
> > Kyle S. Griffin
> > Dept. of Atmospheric and Environmental Sciences
> > University at Albany, SUNY
> > 1400 Washington Ave, Albany, NY 12222
> > Office: ES-218 Email: kgriffin@albany.edu
> > http://www.atmos.albany.edu/student/kgriffin/
> >
> >
> >
> > On Fri, Jul 13, 2012 at 1:31 PM, antonio avio <
> antonioavio@googlemail.com> wrote:
> > Hi NCL,
> >
> > I've been trying to make some experiments with the script provided by
> Carl Schreck
> > as provided in
> http://www.ncl.ucar.edu/Applications/Scripts/wkSpaceTime_5.ncl
> > I used the same data and the same script firstly in order to understand
> to the way of this
> > code works. The script has successfully compiled. But the problem is i
> always get the error
> > message that:
> >
> > fatal:syntax error: line 109 before or near \n
> > tTick( origData&time, res, resTick )
> > ---------------------------------------^
> >
> > fatal:syntax error: possibly an undefined procedure
> > fatal:Syntax Error in block, block not executed
> > fatal:error at line 129
> >
> > But, i f compiled this script by command ncl -X scritp.ncl
> > everything was fine but the time plot is wrong.
> > anybody has an idea?
> >
> > the script and the plot results i attached here.
> >
> > Thanks,
> > Antonio
> >
> >
> >
> > _______________________________________________
> > ncl-talk mailing list
> > List instructions, subscriber options, unsubscribe:
> > http://mailman.ucar.edu/mailman/listinfo/ncl-talk
> >
> >
> >
> >
> >
> >
> > _______________________________________________
> > ncl-talk mailing list
> > List instructions, subscriber options, unsubscribe:
> > http://mailman.ucar.edu/mailman/listinfo/ncl-talk
>
>
>
_______________________________________________
ncl-talk mailing list
List instructions, subscriber options, unsubscribe:
http://mailman.ucar.edu/mailman/listinfo/ncl-talk
- application/octet-stream attachment: script_fixed.ncl