Date: Tue Jul 24 2012 - 04:04:26 MDT
Dear David, dear Mary,
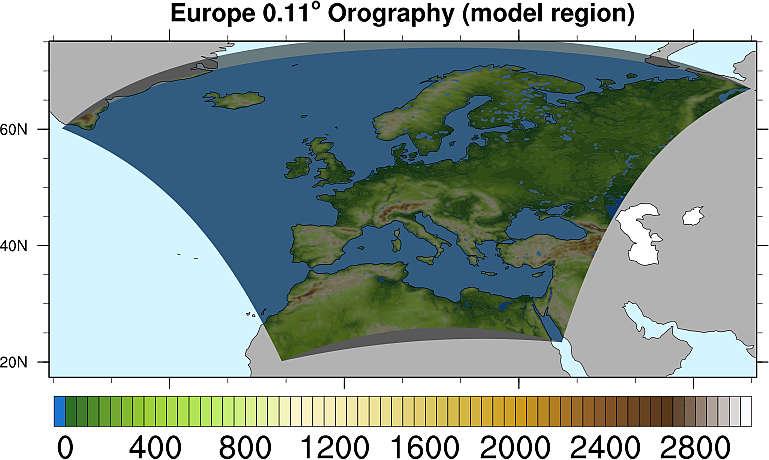
the use of the resource 'mpGreatCircleLinesOn = True' or Mary's script
produced same looking plots, but the lines don't fit the edges
of the data, just close to it (see plot_mpGreatCircleLinesOn.png).
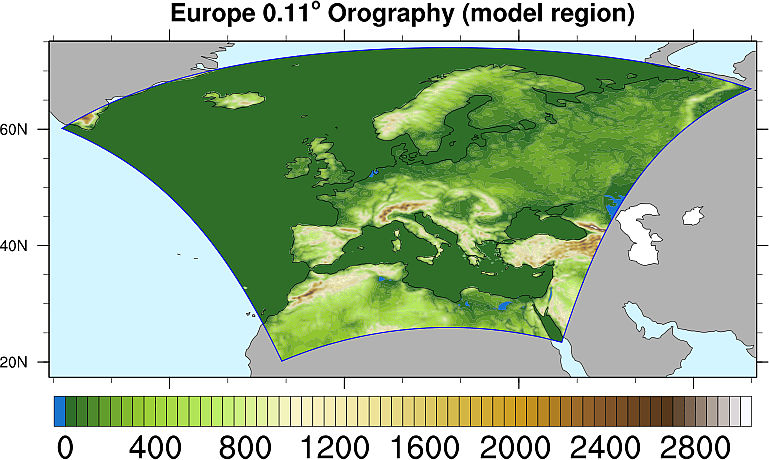
Using the lon2d and lat2d arrays directly when plotting polylines along
the edges, the lines are fitting now (see plot_read_2d_grid_values.png).
/;-- polyline resources
resl = True ; polyline
mods desired
resl@gsLineThicknessF = 2.0 ; line thickness
resl@gsLineColor = "blue" ; color of lines
;-- define edges
lon_val_upper = lon2d(nlat-1,:)
lat_val_upper = lat2d(nlat-1,:)
lon_val_lower = lon2d(0,:)
lat_val_lower = lat2d(0,:)
lon_val_left = lon2d(:,0)
lat_val_left = lat2d(:,0)
lon_val_right = lon2d(:,nlon-1)
lat_val_right = lat2d(:,nlon-1)
;-- draw edges
upper = gsn_add_polyline(wks,plot, lon_val_upper, lat_val_upper, resl)
lower = gsn_add_polyline(wks,plot, lon_val_lower, lat_val_lower, resl)
left = gsn_add_polyline(wks,plot, lon_val_left, lat_val_left, resl)
right = gsn_add_polyline(wks,plot, lon_val_right, lat_val_right, resl)/
Thank you for your help,
Karin
Am 23.07.2012 19:50, schrieb David Brown:
> An easier approach might be simply to set the resource mpGreatCircleLinesOn to True. (see http://www.ncl.ucar.edu/Document/Graphics/Resources/mp.shtml#mpGreatCircleLinesOn)
> -dave
>
> On Jul 23, 2012, at 10:02 AM, Mary Haley wrote:
>
>> Hi,
>>
>> Just as Rick answered your question, I was finishing up an example.
>>
>> He's right, you need to programmatically generate intermediate points along each lat/lon line, which you can do with the gc_latlon function.
>>
>> See attached example and images. Since we don't have your data, I took your script, removed all the contouring stuff, and made a best guess at the lat/lon corners.
>>
>> This example was taken from example polyg_13.ncl at:
>>
>> http://www.ncl.ucar.edu/Applications/polyg.shtml#ex13
>>
>> --Mary
>>
>> On Jul 23, 2012, at 9:57 AM, Rick Brownrigg wrote:
>>
>>> Hi Karin,
>>>
>>> I take it the lines of the polygon are along constant lines of lat/lon? One thing that comes to mind is to programmatically generate samples at intermediate points along the lines of lat/lon, to approximate the curved lines. I haven't tried this (I don't have your dataset handy), but it should work.
>>>
>>> Hope that helps�
>>> Rick
>>>
>>> On Jul 23, 2012, at 8:11 AM, Karin Meier-Fleischer wrote:
>>>
>>>> Hi,
>>>>
>>>> unfortunately, I have problems drawing an opac polygon on a the orography data field (on a rotated grid).
>>>> It was not a problem to plot the map and the contour lines of the orography, but the polygon always
>>>> has straight edges instead curved ones.
>>>>
>>>> I want to display different regions with different grid resolutions in one picture to have a nice overview
>>>> of the different domains. I append the script and a small plot.
>>>>
>>>> Any help would be appreciated.
>>>>
>>>> Thanks,
>>>> Karin
>>>>
>>>> --
>>>> Karin Meier-Fleischer
>>>>
>>>> Department Data Management
>>>> Deutsches Klimarechenzentrum GmbH
>>>> Bundesstrasse 45a
>>>> D-20146 Hamburg, Germany
>>>> email:
>>>> meier-fleischer@dkrz.de
>>>>
>>>> phone: +49 40 41173 288
>>>> fax: +49 40 41173 476
>>>>
>>>> http://www.dkrz.de/
>>>> <plot_rotated_HSURF_EUR-11_model_region_with_box.ksh><plot_HSURF_EUR-11_box_800_616.png>_______________________________________________
>>>> ncl-talk mailing list
>>>> List instructions, subscriber options, unsubscribe:
>>>> http://mailman.ucar.edu/mailman/listinfo/ncl-talk
>>> _______________________________________________
>>> ncl-talk mailing list
>>> List instructions, subscriber options, unsubscribe:
>>> http://mailman.ucar.edu/mailman/listinfo/ncl-talk
>> <plot.ncl><straight.png><curve.png>_______________________________________________
>> ncl-talk mailing list
>> List instructions, subscriber options, unsubscribe:
>> http://mailman.ucar.edu/mailman/listinfo/ncl-talk
>
--
Karin Meier-Fleischer
Department Data Management
Deutsches Klimarechenzentrum GmbH
Bundesstrasse 45a
D-20146 Hamburg, Germany
email: meier-fleischer@dkrz.de
phone: +49 40 41173 288
fax:   +49 40 41173 476
http://www.dkrz.de/
_______________________________________________
ncl-talk mailing list
List instructions, subscriber options, unsubscribe:
http://mailman.ucar.edu/mailman/listinfo/ncl-talk