Date: Thu Sep 13 2012 - 16:55:59 MDT
HI NCL User,
I needd a little bit help.
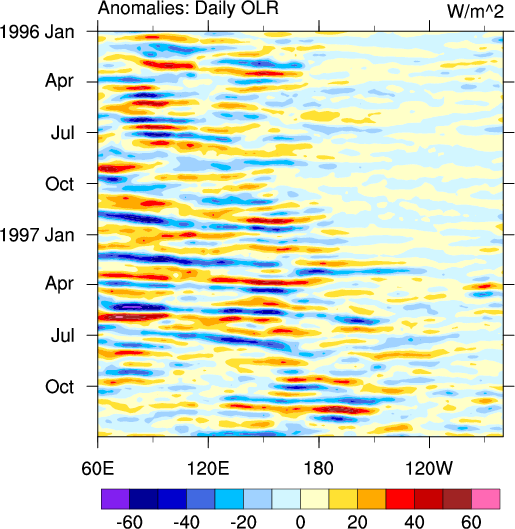
I do want to produce the same color bar as attached mjoclivar_5 [same
interval], for my olr anomalies data. To achieve that i have set:
[SNIP]
gsn_define_colormap(wks,"ncl_default")
--
res@cnLevelSelectionMode= "ExplicitLevels"
res@cnLevels = (/ -60, -40, -20, 0, 20, 40, 60/)
res@gsnSpreadColors = True
res@lbLabelStride = 1
res@lbOrientation = "vertical"
But it did not produce what i expected. can you help me a little bit.
Erika,
_______________________________________________
ncl-talk mailing list
List instructions, subscriber options, unsubscribe:
http://mailman.ucar.edu/mailman/listinfo/ncl-talk