I have read .img files from ENVI (which uses IDL) into NCL using the following:
mydata = fbindirread(filename, 0, (/2300,1400/), "float")
the problem is this reads the floating point data only and you need to read in the coordinates seperately or recreate the coordinates within NCL. The img header file will include information that may be useful in recreating coordinates.
Kat Bormann
PhD Research Candidate
Climate Change Research Centre
University of New South Wales
Kensington Campus, Sydney, NSW
Email: k.bormann@student.unsw.edu.au
http://web.science.unsw.edu.au/~katbormann/
http://hydrology.unsw.edu.au/student/bormann/
Mob: 0402 573 380
________________________________________
From: ncl-talk-bounces@ucar.edu [ncl-talk-bounces@ucar.edu] on behalf of ncl-talk-request@ucar.edu [ncl-talk-request@ucar.edu]
Sent: Sunday, October 21, 2012 5:00 AM
To: ncl-talk@ucar.edu
Subject: ncl-talk Digest, Vol 107, Issue 28
Send ncl-talk mailing list submissions to
ncl-talk@ucar.edu
To subscribe or unsubscribe via the World Wide Web, visit
http://mailman.ucar.edu/mailman/listinfo/ncl-talk
or, via email, send a message with subject or body 'help' to
ncl-talk-request@ucar.edu
You can reach the person managing the list at
ncl-talk-owner@ucar.edu
When replying, please edit your Subject line so it is more specific
than "Re: Contents of ncl-talk digest..."
Today's Topics:
1. unsubscribe (Brad Horn)
2. Re: Reading binary file from IDL program (Dennis Shea)
3. Re: how to use loop to read in multiple nc files (Dennis Shea)
----------------------------------------------------------------------
Message: 1
Date: Fri, 19 Oct 2012 14:03:47 -0400
From: Brad Horn <bxhorn@gmail.com>
Subject: unsubscribe
To: ncl-talk@ucar.edu
Message-ID: <87329FFB-AAE8-48B2-B862-2437A0B7BF3D@gmail.com>
Content-Type: text/plain; charset=us-ascii
unsubscribe
On Oct 19, 2012, at 2:00 PM, ncl-talk-request@ucar.edu wrote:
> Send ncl-talk mailing list submissions to
> ncl-talk@ucar.edu
>
> To subscribe or unsubscribe via the World Wide Web, visit
> http://mailman.ucar.edu/mailman/listinfo/ncl-talk
> or, via email, send a message with subject or body 'help' to
> ncl-talk-request@ucar.edu
>
> You can reach the person managing the list at
> ncl-talk-owner@ucar.edu
>
> When replying, please edit your Subject line so it is more specific
> than "Re: Contents of ncl-talk digest..."
>
>
> Today's Topics:
>
> 1. Re: Cross-section plots (Dennis Shea)
> 2. Re: FW: I mean regridding the data to a rectiliniear lat /
> lon grid (Dennis Shea)
> 3. Re: Why min/max are different from the actual range? (Dennis Shea)
> 4. Re: Cross-section plots (astroqing)
> 5. Re: Why min/max are different from the actual range? (Wen.J.Qu)
> 6. Re: Opacity in contour plot (brownrig@ucar.edu)
> 7. Re: Cross-section plots (Dennis Shea)
> 8. Re: boxplot (Adam Phillips)
> 9. how to use loop to read in multiple nc files (Ke Deng)
> 10. Re: how to use loop to read in multiple nc files (Soumik Basu)
>
>
> ----------------------------------------------------------------------
>
> Message: 1
> Date: Fri, 19 Oct 2012 07:14:37 -0600
> From: Dennis Shea <shea@ucar.edu>
> Subject: Re: Cross-section plots
> To: astroqing <astroqing@gmail.com>
> Cc: ncl-talk <ncl-talk@ucar.edu>
> Message-ID: <5081523D.1080908@ucar.edu>
> Content-Type: text/plain; charset=ISO-8859-1; format=flowed
>
> Please look at the Examples page:
> http://www.ncl.ucar.edu/Applications/
>
> Under 'Plot Types'
>
> Press/height vs. latitude
> Press/height vs. longitude
> Press/height vs. time
>
> If you need an arbitrary cross section, see
>
> http://www.ncl.ucar.edu/Document/Functions/Contributed/linint2_points_Wrap.shtml
>
> Cross sections are just regular contour plots wher
>
> y -> {height, pressure, depth}
> x -> {lat,lon,time}
>
> ================================================
>
> If you are "new to NCL", please read the mini-Language manual at
>
> http://www.ncl.ucar.edu/Document/Manuals/
>
>
>
> On 10/19/12 12:43 AM, astroqing wrote:
>> Hi,
>> I am new to NCL and I want to
>> draw cross-section plots with Ncep Reanalysis data which is in lat/lon
>> projection.
>> I only find the sample scripts used to draw WRF output with the
>> functions wrf_user_intrp3d( ) to interpolate variable horizontally, and
>> it can not be used in Ncep data.
>> So I am writing to ask if you can help and tell me how to solve the problem?
>> Thanks a lot!
>> Tao Qing
>> 2012-10-19
>> ------------------------------------------------------------------------
>>
>>
>> _______________________________________________
>> ncl-talk mailing list
>> List instructions, subscriber options, unsubscribe:
>> http://mailman.ucar.edu/mailman/listinfo/ncl-talk
>>
>
>
> ------------------------------
>
> Message: 2
> Date: Fri, 19 Oct 2012 07:20:27 -0600
> From: Dennis Shea <shea@ucar.edu>
> Subject: Re: FW: I mean regridding the data to a
> rectiliniear lat / lon grid
> To: Ping Yang <pyang@ccny.cuny.edu>
> Cc: ncl-talk@ucar.edu
> Message-ID: <5081539B.30903@ucar.edu>
> Content-Type: text/plain; charset=UTF-8; format=flowed
>
> You want to regrid.
>
> The Lambert Conformal is 'curvilinear grid' and you want to
> regrid to a 'rectilinear grid'. There are numerous examples on
> the 'ESMF Regrid' page
>
> http://www.ncl.ucar.edu/Applications/ then "ESMF Regridding"
>
> Examples 5 and 8 couls serve as a basis for your needs
>
>
> On 10/18/12 9:48 PM, Ping Yang wrote:
>> Hi David,
>>
>> I am just following on a previous posted topic related to Lambert
>> Conformal Conic grid, I plan to re-project (or regrid) a grid data which
>> has the following information:
>>
>> dimensions:
>> x = 189 ;
>> y = 227 ;
>> time = 365 ;
>> nv = 2 ;
>> variables:
>> short lambert_conformal_conic ;
>> lambert_conformal_conic:grid_mapping_name = "lambert_conformal_conic" ;
>> lambert_conformal_conic:longitude_of_central_meridian = -100. ;
>> lambert_conformal_conic:latitude_of_projection_origin = 42.5 ;
>> lambert_conformal_conic:false_easting = 0. ;
>> lambert_conformal_conic:false_northing = 0. ;
>> lambert_conformal_conic:standard_parallel = 25., 60. ;
>> double x(x) ;
>> x:units = "m" ;
>> x:long_name = "x coordinate of projection" ;
>> x:standard_name = "projection_x_coordinate" ;
>> double y(y) ;
>> y:units = "m" ;
>> y:long_name = "y coordinate of projection" ;
>> y:standard_name = "projection_y_coordinate" ;
>> double time(time) ;
>> time:long_name = "time" ;
>> time:calendar = "standard" ;
>> time:units = "days since 1980-01-01 00:00:00 UTC" ;
>> time:bounds = "time_bnds" ;
>> double lat(y, x) ;
>> lat:units = "degrees_north" ;
>> lat:long_name = "latitude coordinate" ;
>> lat:standard_name = "latitude" ;
>> double lon(y, x) ;
>> lon:units = "degrees_east" ;
>> lon:long_name = "longitude coordinate" ;
>> lon:standard_name = "longitude" ;
>> short yearday(time) ;
>> yearday:long_name = "yearday" ;
>> yearday:valid_range = 1s, 365s ;
>> float prcp(time, y, x) ;
>> prcp:long_name = "daily total precipitation" ;
>> prcp:units = "mm/day" ;
>> prcp:missing_value = -9999.f ;
>> prcp:_FillValue = -9999.f ;
>> prcp:valid_range = 0.f, 200.f ;
>> prcp:coordinates = "lat lon" ;
>> prcp:grid_mapping = "lambert_conformal_conic" ;
>> prcp:cell_methods = "area: sum time: sum" ;
>> double time_bnds(time, nv) ;
>>
>> I need to do the following:
>>
>> 1) change the projection into lat/lon
>> 2)regrid the data from higher resolution into lower resolution(aggregating)
>>
>> I am asking which will be the first to do and how can I do
>> it(lambert_conformal_conic to lon/lat).
>>
>> Looking forward to hearing from you.
>>
>> Best Regards
>>
>> Ping
>>
>>
>>
>> On Fri, Aug 10, 2012 at 4:00 PM, David Brown <dbrown@ucar.edu
>> <mailto:dbrown@ucar.edu>> wrote:
>>
>> Hi Gualberto,
>> I am enclosing a modified version of the script that uses NCL to
>> generate the 2D lat/lon coordinate arrays and write them to a file.
>> To demonstrate their correctness, it uses them to
>> transform the data into an orthographic projection. You can use the
>> lat/lon arrays to perform the re-gridding, step 4 of the process
>> outlined by Dave Allured. For that I recommend studying the
>> ESMF regridding examples at
>> http://www.ncl.ucar.edu/Applications/ESMF.shtml. You will need NCL
>> 6.1.0-beta if you don't have it already. I also am attaching the
>> orthographic plot.
>> -dave
>>
>>
>>
>>
>> On Aug 9, 2012, at 11:41 PM, Gualberto Hern?ndez Ju?rez wrote:
>>
>>> Dave,
>>>
>>> I offer youexcuseforlatereply,
>>>
>>> So I understandwith the file yousent me"lcnative.ncl"I can nowrun
>>> theregridding?
>>>
>>> You will havesomevery basicexamplethat can serve asreferenceto do
>>> it?I supposeI have to useESMF.
>>>
>>> Thanks,
>>> Gualberto
>>>
>>> ------------------------------------------------------------------------
>>> Subject: Re: FW: I mean regridding the data to a
>>> rectiliniear lat / lon grid
>>> From:dbrown@ucar.edu <mailto:dbrown@ucar.edu>
>>> Date: Thu, 9 Aug 2012 17:02:01 -0600
>>> CC:ncl-talk@ucar.edu <mailto:ncl-talk@ucar.edu>
>>> To:betoic@hotmail.com <mailto:betoic@hotmail.com>
>>>
>>> Hi Gualberto,
>>> I have figured out what I think are the correct (or at least close
>>> enough) parameters to get the right results from the PROJ4 tool. I
>>> think the main issue I was having is that the Lambert Conformal
>>> Conic projection has a singularity over the equator, because it
>>> ceases to be conic and becomes a cylinder. At least NCL does not
>>> work with a single parallel set to 0.0. However, I can make it
>>> work using 2 standard parallels very close to each other (0.0 and
>>> 0.01). The PROJ4 tool does not give up, but the numbers were wrong
>>> if you do not do something similar. Anyway it would now be
>>> possible to generate the 2d lat/lon arrays that you will need for
>>> re-gridding, either just using PROJ4 or by sampling the projected
>>> space in NCL. I am attaching a plot of temperature that I think
>>> shows the map boundaries aligning very well with the data. I also
>>> include the version of the script that created it.
>>> -dave
>>>
>>>
>>>
>>> On Aug 8, 2012, at 1:47 PM, Gualberto Hern?ndez Ju?rez wrote:
>>>
>>> I have not done, mainly becauseArcGisalsolimitedinNetCDFformat
>>>
>>> ------------------------------------------------------------------------
>>> From:dbrown@ucar.edu <mailto:dbrown@ucar.edu>
>>> Subject: Re: FW: I mean regridding the data to a
>>> rectiliniear lat / lon grid
>>> Date: Wed, 8 Aug 2012 12:46:30 -0600
>>> To:betoic@hotmail.com <mailto:betoic@hotmail.com>
>>>
>>> One question: Can you find out the projection parameters
>>> and/or the corner lat/lon values using ArcGIS?
>>> -dave
>>>
>>> On Aug 8, 2012, at 12:35 PM, Gualberto Hern?ndez Ju?rez wrote:
>>>
>>>
>>> Dave,
>>>
>>> This is howI see itinArcGIS,correspondsto the same
>>> variableMSLP.As yousaidthe picture yousent meisa little shaky.
>>>
>>> Gualberto.
>>>
>>>
>>> ------------------------------------------------------------------------
>>> From:dbrown@ucar.edu <mailto:dbrown@ucar.edu>
>>> Subject: Re: FW: I mean regridding the data to
>>> a rectiliniear lat / lon grid
>>> Date: Wed, 8 Aug 2012 11:17:02 -0600
>>> To:betoic@hotmail.com <mailto:betoic@hotmail.com>
>>>
>>> I was hoping for an image with the continental boundaries
>>> correctly placed. To show you what I mean here is the best
>>> I have been able to do using NCL. The trick is to figure
>>> out the correct projection parameters and the lat/lon
>>> locations of the lower left and upper right corner points.
>>> I did this using the PROJ4 projection tool (similar in
>>> capabilities to the tool Dave Allured recommended -- MPS
>>> Geotrans). But I am not sure I got the right values
>>> because it looks to me like the data does not quite fit
>>> the map outlines. I would not trust any re-gridding
>>> operation if I could not first get the the map outlines
>>> correctly placed. It looks to me (based on plotting a
>>> number of the pressure and temperature time steps) that
>>> the lower part of Mexico and Central America is skewed to
>>> the right and that not so much of South America should be
>>> visible. Anyway so you know what I am talking about I am
>>> attaching the plot I came up with in NCL. Also the script
>>> as it exists now. Perhaps you have access to more
>>> information about the projection parameters?
>>> -dave
>>>
>>>
>>>
>>>
>>> On Aug 7, 2012, at 8:20 PM, Gualberto Hern?ndez Ju?rez wrote:
>>>
>>>
>>>
>>> Dave,
>>> I send the image
>>> ------------------------------------------------------------------------
>>> From:dbrown@ucar.edu <mailto:dbrown@ucar.edu>
>>> Subject: Re: FW: I mean regridding the data
>>> to a rectiliniear lat / lon grid
>>> Date: Tue, 7 Aug 2012 18:16:24 -0600
>>> To:betoic@hotmail.com <mailto:betoic@hotmail.com>
>>>
>>> Sorry maybe I misunderstand. I have the NetCDF
>>> file MMOUT_DOMAIN1.nc. But I thought you said you
>>> uploaded an image (picture ??) of the plot you made in
>>> ArcMap. I would like to see the picture if you can
>>> send it.
>>> -dave
>>>
>>> On Aug 7, 2012, at 5:23 PM, Gualberto Hern?ndez Ju?rez
>>> wrote:
>>>
>>> This is the fileMMOUT_DOMAIN1.nc
>>>
>>> The fileyou put inplace it
>>> ftp://ftp.cgd.ucar.edu/incoming/
>>>
>>>
>>> ------------------------------------------------------------------------
>>> From:dbrown@ucar.edu <mailto:dbrown@ucar.edu>
>>> Subject: Re: FW: I mean regridding the
>>> data to a rectiliniear lat / lon grid
>>> Date: Tue, 7 Aug 2012 17:19:16 -0600
>>> To:betoic@hotmail.com <mailto:betoic@hotmail.com>
>>>
>>> (offline)
>>> I need to know what you called the file in order
>>> to retrieve it.
>>> -dave
>>>
>>> On Aug 7, 2012, at 5:10 PM, Gualberto Hern?ndez
>>> Ju?rez wrote:
>>>
>>> Thanks for your replyDave,
>>>
>>> Iplotthe fileonly inArcMap ofArcGIS, place an
>>> imageinthe directory:
>>>
>>>
>>> ftp://ftp.cgd.ucar.edu/incoming/
>>>
>>>
>>> I just have toput the mapof the Mexican republic.
>>>
>>>
>>> ------------------------------------------------------------------------
>>> Subject: Re: FW: I mean regridding
>>> the data to a rectiliniear lat / lon grid
>>> From:dbrown@ucar.edu <mailto:dbrown@ucar.edu>
>>> Date: Tue, 7 Aug 2012 16:41:41 -0600
>>> CC:ncl-talk@ucar.edu <mailto:ncl-talk@ucar.edu>
>>> To:betoic@hotmail.com <mailto:betoic@hotmail.com>
>>>
>>> Hi Gaulberto,
>>> Here is a way to write the text file as X/Y
>>> pairs as Dave Allured suggested:
>>>
>>> f = addfile ("MMOUT_DOMAIN1.nc", "r")
>>> x = f->lon
>>> y = f->lat
>>> nx = dimsizes(x)
>>> ny = dimsizes(y)
>>> x2d = conform_dims((/ny,nx/),x,1)
>>> y2d = conform_dims((/ny,nx/),y,0)
>>> outstr = sprintf("%9.3f",x2d) + " " +
>>> sprintf("%9.3f",y2d)
>>> asciiwrite("xy.txt",outstr)
>>>
>>> I wonder if you have a plot of this grid in
>>> its native (Lambert Conformal) configuration.
>>> I have tried to plot it based on the LC
>>> parameters given in the data file, but so far
>>> I have been unsuccessful.
>>> A correct plot of the domain would help.
>>>
>>> If you can get NCL to plot the data correctly
>>> in its native projection, then it is possible
>>> to compute the lat/lon coordinates using NCL
>>> by itself.
>>> -dave
>>>
>>>
>>> On Aug 7, 2012, at 2:06 PM, Gualberto
>>> Hern?ndez Ju?rez wrote:
>>>
>>> Dave,
>>> How to make the text file, which you
>>> mention in the first point.
>>>
>>> Thanks
>>> Gualberto
>>>
>>>> Date: Tue, 7 Aug 2012 11:44:09 -0600
>>>> Subject: Re: I mean regridding the data to a rectiliniear lat / lon grid
>>>> From:dave.allured@noaa.gov
>>> <mailto:dave.allured@noaa.gov>
>>>> To:betoic@hotmail.com <mailto:betoic@hotmail.com>
>>>> CC:ncl-talk@ucar.edu <mailto:ncl-talk@ucar.edu>
>>>>
>>>> Here is one way. I am sure there are others.
>>>>
>>>> 1. Use NCL to make a text file containing a 1-dimensional ordered
>>>> list of all X/Y coordinate pairs.
>>>>
>>>> 2. Use MPS Geotrans in batch mode to translate the list of
>>>> coordinates from Lambert Conformal to terrestrial lat/lon. It's free
>>>> software, and it supports a huge variety of known terrestrial
>>>> coordinate systems.
>>>>
>>>> http://earth-info.nga.mil/GandG/geotrans/
>>>>
>>>> 3. Use NCL to read in the translated coordinates, and reshape them
>>>> into 2-D lat and lon coordinate arrays.
>>>>
>>>> 4. Use one of the many NCL regridding functions, plus the 2-D
>>>> coordinates from step 3, to regrid the data array to a rectilinear
>>>> grid of your choice.
>>>>
>>>> This is an overview. Steps 1 and 3 are fairly straightforward NCL
>>>> coding. Steps 2 and 4 will involve significant study to get them
>>>> working correctly. HTH.
>>>>
>>>> --Dave
>>>>
>>>> On Tue, Aug 7, 2012 at 10:54 AM, Gualberto Hern?ndez Ju?rez
>>>> <betoic@hotmail.com
>>> <mailto:betoic@hotmail.com>> wrote:
>>>>> I need *regrid* the 2D lat/lon to a rectilinear lat lon.
>>>>>
>>>>> any comments will be grateful enough support, I'm new to NCL.
>>>>>
>>>>> Thank you,
>>>>> Gualberto
>>>>>
>>>>>
>>>>>> Date: Tue, 7 Aug 2012 10:41:42 -0600
>>>>>> From:shea@ucar.edu <mailto:shea@ucar.edu>
>>>>>> To:betoic@hotmail.com <mailto:betoic@hotmail.com>
>>>>>> CC:ncl-talk@ucar.edu <mailto:ncl-talk@ucar.edu>
>>>>>> Subject: Re: I mean regridding the data to a rectiliniear lat /
>>>>>> lon grid
>>>>>>
>>>>>> Technically, this is already a rectilinear grid.
>>>>>>
>>>>>> double lat ( lat )
>>>>>> _CoordinateAxisType : GeoY
>>>>>> axis : Y
>>>>>> grid_spacing : 27.0 km
>>>>>> long_name : y coordinate of projection
>>>>>> standard_name : projection_y_coordinate
>>>>>> units : km
>>>>>>
>>>>>> double lon ( lon )
>>>>>> _CoordinateAxisType : GeoX
>>>>>> axis : X
>>>>>> grid_spacing : 27.0 km
>>>>>> long_name : x coordinate of projection
>>>>>> standard_name : projection_x_coordinate
>>>>>> units : km
>>>>>>
>>>>>> float u10 ( time, lat, lon )
>>>>>> long_name : 10 m u wind (m/sec)
>>>>>> _FillValue : -9999
>>>>>> grid_mapping : Lambert_Conformal
>>>>>>
>>>>>> The issue is that the poorly named 'lat' and 'lon' variables
>>>>>> should be (say) 'y' and 'x'.
>>>>>>
>>>>>> Basically, the projection information
>>>>>>
>>>>>> character Lambert_Conformal ( ncl_scalar )
>>>>>> grid_mapping_name : lambert_conformal_conic
>>>>>> long_name :
>>>>>> latitude_of_projection_origin : 0
>>>>>> longitude_of_central_meridian : -124.17
>>>>>> false_easting : 0
>>>>>> false_northing : -27
>>>>>> standard_parallel : 0
>>>>>> _CoordinateTransformType : Projection
>>>>>> _CoordinateAxisTypes : GeoX GeoY
>>>>>> earth_shape : Earth spherical with radius of 6,371,229.0 m
>>>>>> earth_radius : 6371229
>>>>>>
>>>>>> must be used to generate two-dimensional latitude and longitude
>>>>>> coordinates for each grid point. Then the data can be plotted on the
>>>>>> lambert map projection. Is this what you want?
>>>>>>
>>>>>> *** I have no idea how to do this. Maybe someone else does. ***
>>>>>>
>>>>>> Then, if you really want to *regrid* the 2D lat/lon to a rectilinear
>>>>>> lat lon, you would have to use the ESMF regridding
>>>>>> http://www.ncl.ucar.edu/Applications/ESMF.shtml
>>>>>>
>>>>>>
>>>>>> On 8/7/12 10:12 AM, Gualberto Hern?ndez Ju?rez wrote:
>>>>>>> Hi,
>>>>>>>
>>>>>>> I mean regridding the data to a rectiliniear lat / lon grid
>>>>>>>
>>>>>>> locate the file in the directory:
>>>>>>>
>>>>>>> ftp://ftp.cgd.ucar.edu/incoming/
>>>>>>>
>>>>>>> or you can download from this link:
>>>>>>>
>>>>>>> https://dl.dropbox.com/u/96409134/MMOUT_DOMAIN1.nc
>>>>>>>
>>>>>>> Thanks I'll be awaiting your response.
>>>>>>> Gualberto
>>> _______________________________________________
>>> ncl-talk mailing list
>>> List instructions, subscriber options,
>>> unsubscribe:
>>> http://mailman.ucar.edu/mailman/listinfo/ncl-talk
>>>
>>>
>>> _______________________________________________
>>> ncl-talk mailing list
>>> List instructions, subscriber options,
>>> unsubscribe:
>>> http://mailman.ucar.edu/mailman/listinfo/ncl-talk
>>>
>>>
>>>
>>>
>>> <Huracan
>>> Bud.jpg>_______________________________________________
>>> ncl-talk mailing list
>>> List instructions, subscriber options, unsubscribe:
>>> http://mailman.ucar.edu/mailman/listinfo/ncl-talk
>>>
>>>
>>> <PresionSNivelMar23-05-2012_4-00pm.jpg>_______________________________________________
>>> ncl-talk mailing list
>>> List instructions, subscriber options, unsubscribe:
>>> http://mailman.ucar.edu/mailman/listinfo/ncl-talk
>>>
>>>
>>> _______________________________________________
>>> ncl-talk mailing list
>>> List instructions, subscriber options, unsubscribe:
>>> http://mailman.ucar.edu/mailman/listinfo/ncl-talk
>>>
>>>
>>>
>>
>>
>> _______________________________________________
>> ncl-talk mailing list
>> List instructions, subscriber options, unsubscribe:
>> http://mailman.ucar.edu/mailman/listinfo/ncl-talk
>>
>> --
>> Ping Yang, Ph.D.
>> CUNY Environmental Crossroads Initiative
>> Marshak Science Building - Suite 925
>> The City College of New York - CUNY
>> 160 Convent Avenue, New York NY 10031
>> Phone: 212-650-5769
>> Fax: 212-650-7064
>>
>>
>> <http://mailman.ucar.edu/mailman/listinfo/ncl-talk>
>>
>>
>> _______________________________________________
>> ncl-talk mailing list
>> List instructions, subscriber options, unsubscribe:
>> http://mailman.ucar.edu/mailman/listinfo/ncl-talk
>>
>
>
> ------------------------------
>
> Message: 3
> Date: Fri, 19 Oct 2012 07:28:36 -0600
> From: Dennis Shea <shea@ucar.edu>
> Subject: Re: Why min/max are different from the actual
> range?
> To: Wen.J.Qu@gmail.com
> Cc: ncl-talk <ncl-talk@ucar.edu>
> Message-ID: <50815584.40904@ucar.edu>
> Content-Type: text/plain; charset=ISO-8859-1; format=flowed
>
> This issue has been discussed many times on ncl-talk.
> See the FAQ and email archives.
> ==========
> As indicated, your data are type short.
> They also have a 'scale_factor' and 'add_offset'
>
> Variable: hgt
> Type: short
>
> add_offset : 32066
> scale_factor : 1
>
> These must be unpacked (unscaled) prior to use. The formula is
>
> unpacked_value = packed_value*scale_factor + add_offset
>
> NCL has a function located in contributed.ncl for this.
> It preserves all meta data.
>
> http://www.ncl.ucar.edu/Document/Functions/Contributed/short2flt.shtml
>
> load "$NCARG_ROOT/lib/ncarg/nclscripts/csm/contributed.ncl"
>
> hgt = short2flt( f->hgt(:,5,:,:) )
>
>
>
> On 10/19/12 12:52 AM, Wen.J.Qu wrote:
>> Hi, all
>> When I read a .nc file, printVarSummary shows the 3D variable "hgt" has
>> an actual range of "-527, 32307 "
>> But when I use the line {print("hgt min/max = " + min(hgt) + "/"
>> + max(hgt))} to print the min and max, it shows "hgt min/max =
>> -27627/-26066"
>> Please help me to give some hint about the problem of this code. Is it
>> from my calculation of min and max with the "short" data type? Is it
>> from the wrong setting of the missing value? Or is it from my probably
>> some wrong in reading the .nc file?
>> Thanks a lot in advance.
>> Shawn
>> ##############################################################
>> code
>> ##############################################################
>> fil = systemfunc ("cd " + diri + " ; ls hgt."+YEAR+".nc")
>> f = addfile(diri+fil,"r")
>> ;Debugprint
>> printVarSummary(f)
>> hgt = f->hgt(:,5,:,:)
>> ;Debugprint
>> printVarSummary(hgt)
>> print("hgt min/max = " + min(hgt) + "/" + max(hgt))
>> ##############################################################
>> ##############################################################
>> print result
>> ##############################################################
>> Variable: hgt
>> Type: short
>> Total Size: 7673760 bytes
>> 3836880 values
>> Number of Dimensions: 3
>> Dimensions and sizes: [time | 365] x [lat | 73] x [lon | 144]
>> Coordinates:
>> time: [17373888..17382624]
>> lat: [90..-90]
>> lon: [ 0..357.5]
>> Number Of Attributes: 19
>> level : 500
>> long_name : mean Daily Geopotential height
>> actual_range : ( -527, 32307 )
>> unpacked_valid_range : ( -700, 35000 )
>> units : m
>> add_offset : 32066
>> scale_factor : 1
>> missing_value : 32766
>> precision : 0
>> least_significant_digit : 0
>> GRIB_id : 7
>> GRIB_name : HGT
>> var_desc : Geopotential height
>> dataset : NCEP Reanalysis Daily Averages
>> level_desc : Multiple levels
>> statistic : Mean
>> parent_stat : Individual Obs
>> valid_range : ( -32766, 2934 )
>> _FillValue : 32766
>> (0) hgt min/max = -27627/-26066
>> ##############################################################
>> ------------------------------------------------------------------------
>> Wen.J.Qu
>> 2012-10-19
>>
>>
>> _______________________________________________
>> ncl-talk mailing list
>> List instructions, subscriber options, unsubscribe:
>> http://mailman.ucar.edu/mailman/listinfo/ncl-talk
>>
>
>
> ------------------------------
>
> Message: 4
> Date: Fri, 19 Oct 2012 22:25:07 +0800
> From: "astroqing" <astroqing@gmail.com>
> Subject: Re: Cross-section plots
> To: "Dennis Shea" <shea@ucar.edu>
> Cc: ncl-talk <ncl-talk@ucar.edu>
> Message-ID: <50816262.0288440a.0cad.ffff85d9@mx.google.com>
> Content-Type: text/plain; charset="utf-8"
>
> Thanks for your reply. I have read the introduction of function linint2_points_Wrap(), but still something i can not understand clearly.
> So if you can send me an example scripts about how to do arbitrary cross section, I will appreciate it very much.
> Best wishes!
>
> ------------------
>
> 2012-10-19
>
> -------------------------------------------------------------
> ????Dennis Shea <shea@ucar.edu>
> ?????2012-10-19 21:14
> ????astroqing
> ???ncl-talk
> ???Re: [ncl-talk] Cross-section plots
>
> Please look at the Examples page:
> http://www.ncl.ucar.edu/Applications/
>
> Under 'Plot Types'
>
> Press/height vs. latitude
> Press/height vs. longitude
> Press/height vs. time
>
> If you need an arbitrary cross section, see
>
> http://www.ncl.ucar.edu/Document/Functions/Contributed/linint2_points_Wrap.shtml
>
> Cross sections are just regular contour plots wher
>
> y -> {height, pressure, depth}
> x -> {lat,lon,time}
>
> ================================================
>
> If you are "new to NCL", please read the mini-Language manual at
>
> http://www.ncl.ucar.edu/Document/Manuals/
>
>
>
> On 10/19/12 12:43 AM, astroqing wrote:
>> Hi,
>> I am new to NCL and I want to
>> draw cross-section plots with Ncep Reanalysis data which is in lat/lon
>> projection.
>> I only find the sample scripts used to draw WRF output with the
>> functions wrf_user_intrp3d( ) to interpolate variable horizontally, and
>> it can not be used in Ncep data.
>> So I am writing to ask if you can help and tell me how to solve the problem?
>> Thanks a lot!
>> Tao Qing
>> 2012-10-19
>> ------------------------------------------------------------------------
>>
>>
>> _______________________________________________
>> ncl-talk mailing list
>> List instructions, subscriber options, unsubscribe:
>> http://mailman.ucar.edu/mailman/listinfo/ncl-talk
>>
>
>
> ------------------------------
>
> Message: 5
> Date: Fri, 19 Oct 2012 10:45:32 -0500
> From: "Wen.J.Qu" <wen.j.qu@gmail.com>
> Subject: Re: Why min/max are different from the actual
> range?
> To: "Dennis Shea" <shea@ucar.edu>
> Cc: ncl-talk <ncl-talk@ucar.edu>
> Message-ID: <201210191045321719476@gmail.com>
> Content-Type: text/plain; charset="gb2312"
>
> Thanks a lot, Dennis
>
> Your and Mary's prompt response to problems from new learners is extremely helpful.
>
> Forgive me to rise the question again because I do not know anything about it. There are too many things I need to learn before I can use NCL well.
>
> Thank you again and All my best wishes!
>
>
> Shawn
>
>
>
>
> Wen.J.Qu
> 2012-10-19
>
>
>
> ???? Dennis Shea
> ????? 2012-10-19 08:28:43
> ???? Wen.J.Qu@gmail.com
> ??? ncl-talk
> ??? Re: [ncl-talk] Why min/max are different from the actual range?
>
> This issue has been discussed many times on ncl-talk.
> See the FAQ and email archives.
> ==========
> As indicated, your data are type short.
> They also have a 'scale_factor' and 'add_offset'
>
> Variable: hgt
> Type: short
>
> add_offset : 32066
> scale_factor : 1
>
> These must be unpacked (unscaled) prior to use. The formula is
>
> unpacked_value = packed_value*scale_factor + add_offset
>
> NCL has a function located in contributed.ncl for this.
> It preserves all meta data.
>
> http://www.ncl.ucar.edu/Document/Functions/Contributed/short2flt.shtml
>
> load "$NCARG_ROOT/lib/ncarg/nclscripts/csm/contributed.ncl"
>
> hgt = short2flt( f- >hgt(:,5,:,:) )
>
>
>
> On 10/19/12 12:52 AM, Wen.J.Qu wrote:
>> Hi, all
>> When I read a .nc file, printVarSummary shows the 3D variable "hgt" has
>> an actual range of "-527, 32307 "
>> But when I use the line {print("hgt min/max = " + min(hgt) + "/"
>> + max(hgt))} to print the min and max, it shows "hgt min/max =
>> -27627/-26066"
>> Please help me to give some hint about the problem of this code. Is it
>> from my calculation of min and max with the "short" data type? Is it
>> from the wrong setting of the missing value? Or is it from my probably
>> some wrong in reading the .nc file?
>> Thanks a lot in advance.
>> Shawn
>> ##############################################################
>> code
>> ##############################################################
>> fil = systemfunc ("cd " + diri + " ; ls hgt."+YEAR+".nc")
>> f = addfile(diri+fil,"r")
>> ;Debugprint
>> printVarSummary(f)
>> hgt = f- >hgt(:,5,:,:)
>> ;Debugprint
>> printVarSummary(hgt)
>> print("hgt min/max = " + min(hgt) + "/" + max(hgt))
>> ##############################################################
>> ##############################################################
>> print result
>> ##############################################################
>> Variable: hgt
>> Type: short
>> Total Size: 7673760 bytes
>> 3836880 values
>> Number of Dimensions: 3
>> Dimensions and sizes: [time | 365] x [lat | 73] x [lon | 144]
>> Coordinates:
>> time: [17373888..17382624]
>> lat: [90..-90]
>> lon: [ 0..357.5]
>> Number Of Attributes: 19
>> level : 500
>> long_name : mean Daily Geopotential height
>> actual_range : ( -527, 32307 )
>> unpacked_valid_range : ( -700, 35000 )
>> units : m
>> add_offset : 32066
>> scale_factor : 1
>> missing_value : 32766
>> precision : 0
>> least_significant_digit : 0
>> GRIB_id : 7
>> GRIB_name : HGT
>> var_desc : Geopotential height
>> dataset : NCEP Reanalysis Daily Averages
>> level_desc : Multiple levels
>> statistic : Mean
>> parent_stat : Individual Obs
>> valid_range : ( -32766, 2934 )
>> _FillValue : 32766
>> (0) hgt min/max = -27627/-26066
>> ##############################################################
>> ------------------------------------------------------------------------
>> Wen.J.Qu
>> 2012-10-19
>>
>>
>> _______________________________________________
>> ncl-talk mailing list
>> List instructions, subscriber options, unsubscribe:
>> http://mailman.ucar.edu/mailman/listinfo/ncl-talk
>>
> -------------- next part --------------
> An HTML attachment was scrubbed...
> URL: http://mailman.ucar.edu/pipermail/ncl-talk/attachments/20121019/29420d90/attachment.html
>
> ------------------------------
>
> Message: 6
> Date: Fri, 19 Oct 2012 10:47:22 -0600
> From: <brownrig@ucar.edu>
> Subject: Re: Opacity in contour plot
> To: "imran nadeem" <qphoton@gmail.com>, <ncl-talk@ucar.edu>
> Message-ID: <web-42874045@mail.ucar.edu>
> Content-Type: text/plain;charset=utf-8; format="flowed"
>
> On Fri, 19 Oct 2012 11:17:08 +0200
> Hi Nadeem,
>
> I will look into this first thing next week and get back with you...
>
> Rick
>
> imran nadeem <qphoton@gmail.com> wrote:
>> Dear NCL-developers,
>>
>> I confirm the problem is coming from very "twisty" contours
>> drawn in a small area. I tried to enlarge my plots, but still
>> getting
>> ARSCAM/ARPRAM error.
>> For me the best solution is that cnFillOpacityF works for RasterFill
>> or CellFilll because ARSCAM/ARPRAM error doesn't occur for these
>> contour fill types.
>> In separate email, I sent data + script to Mary for possible fix.
>>
>> Regards
>> Nadeem
>>
>>
>> On Wed, Oct 17, 2012 at 4:35 PM, Mary Haley <haley@ucar.edu> wrote:
>>> Hi Nadeem,
>>>
>>> We are trying to fix the contouring code so that users don't run
>>> into the ARSCAM/ARPRAM error.
>>> Do you still get an image, by any chance? Sometimes you just get a
>>> plot with no data in it.
>>>
>>> To help make this error go away, sometimes making the plot slightly
>>> larger will help. The error
>>> shows up sometimes when you have very "twisty" contours that are
>>> being drawn in a small area.
>>> If you make the plot slightly larger, this can help. We see this
>>> error more when people are
>>> panelling plots. Is that what you're doing here?
>>>
>>> If so, and if I can see a sample image, then I might be able to
>>> suggest ways to make the plots larger.
>>>
>>> Even better, if you can provide me with your data and your script,
>>> then I can try to reproduce the
>>> problem here and see if there's an easy fix. You can ftp your
>>> script and data . See:
>>>
>>> http://www.ncl.ucar.edu/report_bug.shtml#HowToFTP
>>>
>>> Hopefully Rick or Dave will address your question about
>>> cnFillOpacityF not working with
>>> RasterFill or CellFill.
>>>
>>> --Mary
>>>
>>>
>>>
>>> On Oct 17, 2012, at 7:32 AM, imran nadeem wrote:
>>>
>>>> Dear All,
>>>> I am using NCL verion 6.1.0-beta to make partially transparent
>>>> contour plots. For me, the resource "cnFillOpacityF" works only with
>>>> cnFillMode = "AreaFill". It doesn't have any effect on RasterFill or
>>>> CellFill.
>>>> This is problem for me because "AreaFill" is producing the following
>>>> message.
>>>>
>>>> fatal:ContourPlotDraw: ARSCAM/ARPRAM - ALGORITHM FAILURE
>>>> fatal:ContourPlotDraw: draw error
>>>> warning:WorkstationDeactivate: workstation not active or not opened
>>>>
>>>> I can avoid this message by setting cnFillMode to RasterFill but
>>>> then
>>>> I cannot use transparency through cnFillOpacityF.
>>>>
>>>> Any suggestion to solve this problem
>>>> Thanks in advance.
>>>>
>>>> Regards
>>>> Nadeem
>>>> _______________________________________________
>>>> ncl-talk mailing list
>>>> List instructions, subscriber options, unsubscribe:
>>>> http://mailman.ucar.edu/mailman/listinfo/ncl-talk
>>>
>> _______________________________________________
>> ncl-talk mailing list
>> List instructions, subscriber options, unsubscribe:
>> http://mailman.ucar.edu/mailman/listinfo/ncl-talk
>
>
>
> ------------------------------
>
> Message: 7
> Date: Fri, 19 Oct 2012 10:49:52 -0600
> From: Dennis Shea <shea@ucar.edu>
> Subject: Re: Cross-section plots
> To: astroqing <astroqing@gmail.com>
> Cc: ncl-talk <ncl-talk@ucar.edu>
> Message-ID: <508184B0.2000605@ucar.edu>
> Content-Type: text/plain; charset=UTF-8; format=flowed
>
> See:
>
> http://www.ncl.ucar.edu/Applications/transect.shtml#ex1
>
> Just change
>
> linint2_points ==> linint2_points_Wrap
>
>
> likely delete these ...
> trans!0 = "z_t"
> trans&z_t = t&z_t
>
> add
> printVarSummary(trans)
>
> so you can see the result
>
>
> On 10/19/2012 08:25 AM, astroqing wrote:
>> Thanks for your reply. I have read the introduction of function linint2_points_Wrap(), but still something i can not understand clearly.
>> So if you can send me an example scripts about how to do arbitrary cross section, I will appreciate it very much.
>> Best wishes!
>>
>> ------------------
>>
>> 2012-10-19
>>
>> -------------------------------------------------------------
>> ????Dennis Shea <shea@ucar.edu>
>> ?????2012-10-19 21:14
>> ????astroqing
>> ???ncl-talk
>> ???Re: [ncl-talk] Cross-section plots
>>
>> Please look at the Examples page:
>> http://www.ncl.ucar.edu/Applications/
>>
>> Under 'Plot Types'
>>
>> Press/height vs. latitude
>> Press/height vs. longitude
>> Press/height vs. time
>>
>> If you need an arbitrary cross section, see
>>
>> http://www.ncl.ucar.edu/Document/Functions/Contributed/linint2_points_Wrap.shtml
>>
>> Cross sections are just regular contour plots wher
>>
>> y -> {height, pressure, depth}
>> x -> {lat,lon,time}
>>
>> ================================================
>>
>> If you are "new to NCL", please read the mini-Language manual at
>>
>> http://www.ncl.ucar.edu/Document/Manuals/
>>
>>
>>
>> On 10/19/12 12:43 AM, astroqing wrote:
>>> Hi,
>>> I am new to NCL and I want to
>>> draw cross-section plots with Ncep Reanalysis data which is in lat/lon
>>> projection.
>>> I only find the sample scripts used to draw WRF output with the
>>> functions wrf_user_intrp3d( ) to interpolate variable horizontally, and
>>> it can not be used in Ncep data.
>>> So I am writing to ask if you can help and tell me how to solve the problem?
>>> Thanks a lot!
>>> Tao Qing
>>> 2012-10-19
>>> ------------------------------------------------------------------------
>>>
>>>
>>> _______________________________________________
>>> ncl-talk mailing list
>>> List instructions, subscriber options, unsubscribe:
>>> http://mailman.ucar.edu/mailman/listinfo/ncl-talk
>>>
>>
>
>
>
> ------------------------------
>
> Message: 8
> Date: Fri, 19 Oct 2012 11:18:55 -0600
> From: Adam Phillips <asphilli@ucar.edu>
> Subject: Re: boxplot
> To: ncl-talk@ucar.edu, nlcheng <cnl88@163.com>
> Message-ID: <50818B7F.6030303@ucar.edu>
> Content-Type: text/plain; charset="iso-8859-1"
>
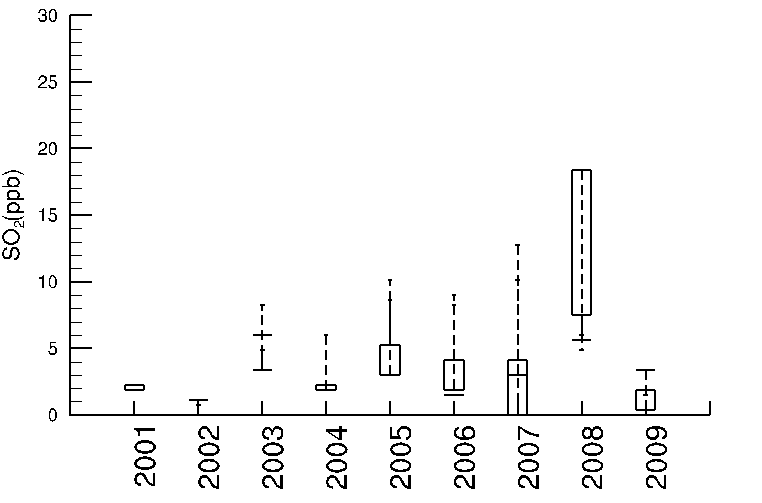
> Hello,
> As I stated yesterday, instead of passing in 5 values per box as the
> documentation states is required, you are passing in 365 values. The box
> plot function wants 5 values in ascending order as is stated in the
> documentation and as is shown in example #1 here:
> http://www.ncl.ucar.edu/Applications/box.shtml#ex1
>
> Modifying some coding from example #1 to simplify it:
>
> yval = new((/2,5/),"float",-999.)
> yval(0,0) = -3.
> yval(0,1) = -1.
> yval(0,2) = 1.5
> yval(0,3) = 4.2
> yval(0,4) = 6.
>
> yval(1,0) = -1.
> yval(1,1) = 0.
> yval(1,2) = 1.
> yval(1,3) = 2.5
> yval(1,4) = 4.
>
> wks = gsn_open_wks("ps","box")
> x = (/-3., -1./)
> plot = boxplot(wks,x,yval,False,False,False)
>
> Note that for box #1 and #2, the values are increasing within the yval
> (0,:) and yval(1,:) arrays. The boxplot function simply plots boxes
> given the input y array values /in the order they are present in the y
> array/.
>
> I am not sure what the data in the file you attached is supposed to
> represent:
>
> 9.75 24 9.375 9 8.25 5.25 12.375 24 11.625
> 4.125 14.625 12 10.125 8.625 11.25 12 12.375 11.625
> 7.5 17.625 12.375 8.625 13.5 10.5 10.875 17.25 12
> 9.375 24.375 9.375 9.375 17.25 13.125 22.5 13.875 9.375
> 6.75 23.25 11.25 11.25 11.25 11.25 29.625 19.875 16.125
> 3.75 28.5 10.125 8.625 14.25 10.5 21.75 16.5 6
> 4.5 26.625 9.375 5.625 10.5 9.375 13.875 14.25 13.125
> 4.875 13.875 12.375 6 12.75 14.625 18.375 18.375 10.875
>
> I ran your code on the input data, and I got the plot that I attached.
> Looking at your input data/coding, you are passing these values in as
> box #1: 9.75, 4.125, 7.5, 9.375, and 6.75. Looking at the first box plot
> in the attached box.png, those values are the ones that are being used
> to draw the box. If you wanted boxplot to draw each boxplot as you
> desire, you would have to input the values /in ascending order/. For
> instance, box #1's values would have to be 4.125, 6.75, 7.5, 9.375, and
> 9.75.
>
> Please look at boxplot example #1 and try modifying/running it so you
> can further understand how the boxplot function works. Adam
>
> On 10/18/2012 09:17 PM, nlcheng wrote:
>> I have uploaded the script and the data .
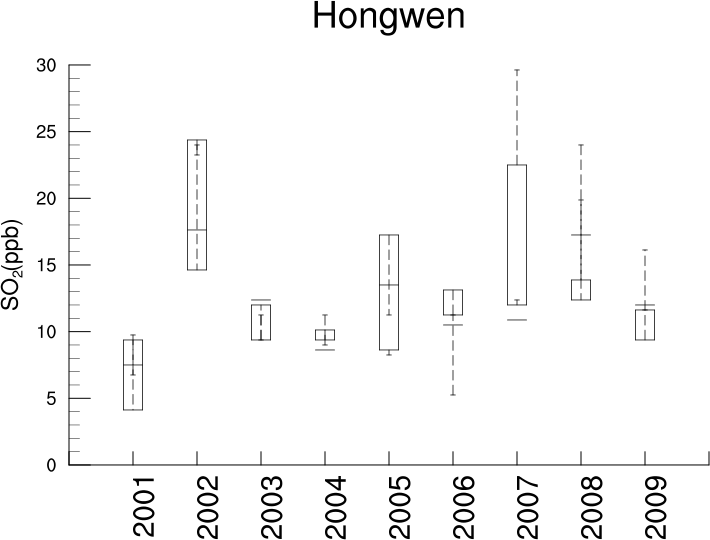
>> When I run the script it turns out the drawing of boxplot like
>> this
>> but the box is in a mess ; not
>> I do not know what is wrong!
>> hope for your help!
>>
>>
>>
>>
>>
>>
>> _______________________________________________
>> ncl-talk mailing list
>> List instructions, subscriber options, unsubscribe:
>> http://mailman.ucar.edu/mailman/listinfo/ncl-talk
>
> --
> ______________________________________________________________
> Adam Phillips asphilli@ucar.edu
> NCAR/Climate and Global Dynamics Division (303) 497-1726
> P.O. Box 3000
> Boulder, CO 80307-3000 http://www.cgd.ucar.edu/cas/asphilli
>
> -------------- next part --------------
> An HTML attachment was scrubbed...
> URL: http://mailman.ucar.edu/pipermail/ncl-talk/attachments/20121019/2035f67b/attachment.html
> -------------- next part --------------
> A non-text attachment was scrubbed...
> Name: not available
> Type: image/png
> Size: 6400 bytes
> Desc: not available
> Url : http://mailman.ucar.edu/pipermail/ncl-talk/attachments/20121019/2035f67b/attachment.png
> -------------- next part --------------
> A non-text attachment was scrubbed...
> Name: not available
> Type: image/png
> Size: 726 bytes
> Desc: not available
> Url : http://mailman.ucar.edu/pipermail/ncl-talk/attachments/20121019/2035f67b/attachment-0001.png
> -------------- next part --------------
> A non-text attachment was scrubbed...
> Name: box.png
> Type: image/png
> Size: 13503 bytes
> Desc: not available
> Url : http://mailman.ucar.edu/pipermail/ncl-talk/attachments/20121019/2035f67b/attachment-0002.png
>
> ------------------------------
>
> Message: 9
> Date: Fri, 19 Oct 2012 12:25:12 -0500
> From: Ke Deng <kdeng1@slu.edu>
> Subject: how to use loop to read in multiple nc files
> To: ncl-talk@ucar.edu
> Message-ID:
> <CAJMcDnD6HEY+T1WWW3jPrryG34e6w-oK2x8L8+ULS-084BAfug@mail.gmail.com>
> Content-Type: text/plain; charset="iso-8859-1"
>
> Dear all,
> I am computing the vertical integrated moisture transport (this is not the
> point) and get the right code for that. But now I meet with one problem.
> The data I use now are rhum.****.nc uwnd.****.nc vwnd.****.nc yearly
> data.(60 nc files for each one so 180 nc files totally) The below code is
> useful for one year data so the code is absolutely right. But now I want to
> compute the moisture transport over 60 years (1948-2007). At first I used
> the ncrcat command in linux to integrate the 60 nc files into one file but
> when I run the code it displayed the segmentation fault. And then I used
> the command systemfunc and addfiles in ncl to process that and also show
> some errors. So the only reason is there are too many files and the
> software can not see them as one big file to process. Now I am stuck here
> and don't know how to write one loop to solve that. Please your response
> will be appreciated! Thank u!
>
> ;***********************************************
> load "$NCARG_ROOT/lib/ncarg/nclscripts/csm/gsn_code.ncl"
> load "$NCARG_ROOT/lib/ncarg/nclscripts/csm/gsn_csm.ncl"
> load "$NCARG_ROOT/lib/ncarg/nclscripts/csm/contributed.ncl"
> ;***********************************************
> ;begin
> ;***********************************************
> ;read in netCDF file
> ;***********************************************
> f1 = addfiles("rhum.1977.nc","r")
> f2 = addfiles("uwnd.1977.nc","r")
> f3 = addfiles("vwnd.1977.nc","r")
> rhum = f1->rhum(:,:,:,:)
> q = rhum/100+302.66
> copy_VarCoords(rhum,q)
> uwnd = f2->uwnd(:,0:7,:,:)
> u = uwnd/100+202.66
> copy_VarCoords(uwnd,u)
> vwnd = f3->vwnd(:,0:7,:,:)
> v = vwnd/100+202.66
> copy_VarCoords(vwnd,v)
>
> qu=q*u
> qv=q*v
> copy_VarCoords(q,qu)
> copy_VarCoords(q,qv)
>
> g = 9.81
> q = qu+qv
> copy_VarCoords(qu,q)
>
> qint = dim_sum_Wrap(q(time|:,lat|:,lon|:,level|:)) ;*integration*******
> Qint = dim_sum_Wrap(qint(lat|:,lon|:,time|:))
> Qint = (Qint/g) ;***********weight by gravity****************
> Qint@units = "kg/ms"
> ;************************************
> ; create the plot1
> ;************************************
> wks=gsn_open_wks("ps","q")
>
> res = True ; plot mods desired
> res@tiMainString = "vertical integrated moisture transport" ;
> main title
> res@cnFillOn = True ; turn on color fill
> plot = gsn_csm_contour_map(wks,Qint(:,:),res)
>
> end
> -------------- next part --------------
> An HTML attachment was scrubbed...
> URL: http://mailman.ucar.edu/pipermail/ncl-talk/attachments/20121019/c69029a6/attachment.html
>
> ------------------------------
>
> Message: 10
> Date: Fri, 19 Oct 2012 09:55:24 -0800
> From: Soumik Basu <sbasu@iarc.uaf.edu>
> Subject: Re: how to use loop to read in multiple nc files
> To: <ncl-talk@ucar.edu>
> Message-ID: <42c2c61147d6f88cddc200ab8806e621@arthur.iarc.uaf.edu>
> Content-Type: text/plain; charset=UTF-8; format=flowed
>
> You can try something like this :
>
> ***********************************************
> load "$NCARG_ROOT/lib/ncarg/nclscripts/csm/gsn_code.ncl"
> load "$NCARG_ROOT/lib/ncarg/nclscripts/csm/gsn_csm.ncl"
> load "$NCARG_ROOT/lib/ncarg/nclscripts/csm/contributed.ncl"
> ;***********************************************
> ;begin
> ;***********************************************
> ;read in netCDF file
> ;***********************************************
>
> do yy = 1948, 2007 ; Start the year loop
>
> f1 = addfiles("rhum."+yy+".nc","r")
> f2 = addfiles("uwnd."+yy+".nc","r")
> f3 = addfiles("vwnd."+yy+".nc","r")
> rhum = f1->rhum(:,:,:,:)
> q = rhum/100+302.66
> copy_VarCoords(rhum,q)
> uwnd = f2->uwnd(:,0:7,:,:)
> u = uwnd/100+202.66
> copy_VarCoords(uwnd,u)
> vwnd = f3->vwnd(:,0:7,:,:)
> v = vwnd/100+202.66
> copy_VarCoords(vwnd,v)
>
> qu=q*u
> qv=q*v
> copy_VarCoords(q,qu)
> copy_VarCoords(q,qv)
>
> g = 9.81
> q = qu+qv
> copy_VarCoords(qu,q)
>
> qint = dim_sum_Wrap(q(time|:,lat|:,lon|:,level|:))
> ;*integration*******
> Qint = dim_sum_Wrap(qint(lat|:,lon|:,time|:))
> Qint = (Qint/g) ;***********weight by
> gravity****************
> Qint@units = "kg/ms"
>
> end do ; end year loop
>
> ;************************************
> ; create the plot1
> ;************************************
> wks=gsn_open_wks("ps","q")
>
> res = True ; plot mods desired
> res@tiMainString = "vertical integrated moisture transport"
> ; main title
> res@cnFillOn = True ; turn on color fill
> plot = gsn_csm_contour_map(wks,Qint(:,:),res)
>
> end
>
>
> On 2012-10-19 09:25, Ke Deng wrote:
>> Dear all,
>> I am computing the vertical integrated moisture transport (this is
>> not the point) and get the right code for that. But now I meet with
>> one problem. The data I use now are rhum.****.nc uwnd.****.nc
>> vwnd.****.nc yearly data.(60 nc files for each one so 180 nc files
>> totally) The below code is useful for one year data so the code is
>> absolutely right. But now I want to compute the moisture transport
>> over 60 years (1948-2007). At first I used the ncrcat command in
>> linux
>> to integrate the 60 nc files into one file but when I run the code it
>> displayed the segmentation fault. And then I used the command
>> systemfunc and addfiles in ncl to process that and also show some
>> errors. So the only reason is there are too many files and the
>> software can not see them as one big file to process. Now I am stuck
>> here and don't know how to write one loop to solve that. Please your
>> response will be appreciated! Thank u!
>>
>> ;***********************************************
>> load "$NCARG_ROOT/lib/ncarg/nclscripts/csm/gsn_code.ncl"
>> load "$NCARG_ROOT/lib/ncarg/nclscripts/csm/gsn_csm.ncl"
>> load "$NCARG_ROOT/lib/ncarg/nclscripts/csm/contributed.ncl"
>> ;***********************************************
>> ;begin
>> ;***********************************************
>> ;read in netCDF file
>> ;***********************************************
>> f1 = addfiles("rhum.1977.nc [2]","r")
>> f2 = addfiles("uwnd.1977.nc [3]","r")
>> f3 = addfiles("vwnd.1977.nc [4]","r")
>> rhum = f1->rhum(:,:,:,:)
>> q = rhum/100+302.66
>> copy_VarCoords(rhum,q)
>> uwnd = f2->uwnd(:,0:7,:,:)
>> u = uwnd/100+202.66
>> copy_VarCoords(uwnd,u)
>> vwnd = f3->vwnd(:,0:7,:,:)
>> v = vwnd/100+202.66
>> copy_VarCoords(vwnd,v)
>>
>> qu=q*u
>> qv=q*v
>> copy_VarCoords(q,qu)
>> copy_VarCoords(q,qv)
>>
>> g = 9.81
>> q = qu+qv
>> copy_VarCoords(qu,q)
>>
>> qint = dim_sum_Wrap(q(time|:,lat|:,lon|:,level|:))?
>> ;*integration*******
>> Qint = dim_sum_Wrap(qint(lat|:,lon|:,time|:))
>> Qint = (Qint/g)??????????? ;***********weight by
>> gravity****************
>> Qint@units = "kg/ms"
>> ;************************************
>> ;? create the plot1
>> ;************************************
>> wks=gsn_open_wks("ps","q")
>>
>> res????????????????????? = True?????????????? ; plot mods desired
>> res@tiMainString???????? = "vertical integrated moisture
>> transport"??? ; main title
>> res@cnFillOn???????????? = True?????????????? ; turn on color fill
>> plot = gsn_csm_contour_map(wks,Qint(:,:),res)
>>
>> end
>>
>>
>>
>> Links:
>> ------
>> [1] http://rhum.1977.nc
>> [2] http://uwnd.1977.nc
>> [3] http://vwnd.1977.nc
>>
>> _______________________________________________
>> ncl-talk mailing list
>> List instructions, subscriber options, unsubscribe:
>> http://mailman.ucar.edu/mailman/listinfo/ncl-talk
>
> --
> "Numbing the pain for a while will make it worse when you finally feel
> it.
> ~J.K. Rowling"
> *****************************************
> Soumik Basu
> Graduate Student, Research Assistant
> International Arctic Research Center
> University of Alaska Fairbanks
> Fairbanks,Alaska,USA
> *****************************************
>
>
> ------------------------------
>
> _______________________________________________
> ncl-talk mailing list
> ncl-talk@ucar.edu
> http://mailman.ucar.edu/mailman/listinfo/ncl-talk
>
>
> End of ncl-talk Digest, Vol 107, Issue 27
> *****************************************
------------------------------
Message: 2
Date: Fri, 19 Oct 2012 14:07:05 -0600
From: Dennis Shea <shea@ucar.edu>
Subject: Re: Reading binary file from IDL program
To: Xin Xi <xxi@gatech.edu>
Cc: "ncl-talk@ucar.edu USERS" <ncl-talk@ucar.edu>
Message-ID: <5081B2E9.5080207@ucar.edu>
Content-Type: text/plain; charset=ISO-8859-1; format=flowed
I do not know IDL.
[1] I assume these are 'flat' binary files. Sometimes software
will write proprietary binary files.
[2] Are you reading the binary file on the same machine it was created?
If not, you may have an 'endian' issue.
"When an IDL or Fortran program saves data to an unformatted file,
it is saving the bytes directly from memory without any further data
processing. If you save data from a Big Endian machine and try to read
it back into a Little Endian machine, then the bytes will be in wrong
order and the data you will be interpreted as gibberish."
If this is the case, see NCL's 'setfileoption' function. This
allows you to tell NCL it should switch the bytes.
[3] Delete the following (generally you should not use this.)
res@tfDoNDCOverlay = True
[4] comment ( ; )the following (unneeded)
res@trGridType = "TriangularMesh"
[5] You do not need to preallocate space for
aod550 = new((/ncols,nrows/),float)
The function will dynamically create the array
[5] Suggest that you change lat1d/lon1d to lat and lon
lon = fspan(lonL+resolution/2,lonR-resolution/2,ncols)
lon!0 = "lon"
lon@units = "degrees_east"
lat = fspan(latS+resolution/2,latN-resolution/2,nrows)
lat!0 = "lat"
lat@units = "degrees_north"
then
aod550!0 = "lon"
aod550!1 = "lat"
aod550&lon = lon
aod550&lat = lat
On 10/19/2012 12:58 AM, Xin Xi wrote:
> Hello,
> I used GDL (an IDL alternative) programs to read multiple MODIS swaths
> over a specified domain during 1 day period, and generated a binary file
> with a 2D gridded array (0.1 deg resolution) by averaging all valid
> MODIS pixels within each 0.1x0.1 grid cell. (Due to a plotting issue on
> my GDL installation,) I then use NCL to read the binary file, and plot
> the dataset, but got wrong result. I donot know where I did wrong, and
> would appreciate it if anyone can point it out for me. Thanks!
>
> I attached the figure with multiple MODIS swaths and the plot result
> from the binary (which is wrong); and the NCL script used to read and
> plot the binary file.
>
>
> begin
> data_dir = "/media/cdata1/data/modis_daily_2d/"
> files = systemfunc("ls "+data_dir+"aod550_2009181*")
> nfiles = dimsizes(files)
>
> latN = 55.0
> latS = 30.0
> lonL = 40.0
> lonR = 80.0
> resolution = 0.1
>
> ncols = floattoint((lonR-lonL)/resolution)
> nrows = floattoint((latN-latS)/resolution)
>
> lon1d = fspan(lonL+resolution/2,lonR-resolution/2,ncols)
> lat1d = fspan(latS+resolution/2,latN-resolution/2,nrows)
> lon1d@units = "degrees_east"
> lat1d@units = "degrees_north"
>
> aod550 = new((/ncols,nrows/),float)
> tmp = new((/nfiles,ncols,nrows/),float)
> tmp@_FillValue = -999.9
>
> do i = 0, nfiles-1
> print("Reading file: "+files(i))
> tmp(i,:,:) = fbindirread(files(i),0,(/ncols,nrows/),"float")
> end do
>
> aod550 = dim_avg_n(tmp,0)
> aod550_std = dim_stddev_n(tmp,0)
>
> aod550!0="lon"
> aod550!1="lat"
> aod550&lon=lon1d
> aod550&lat=lat1d
>
> printVarSummary(aod550)
> print(max(aod550))
> print(min(aod550))
>
> ;====================================
> outfile = "mm"
> type = "newpng"
> wks = gsn_open_wks(type, outfile)
> gsn_define_colormap(wks,"wh-bl-gr-ye-re");"rainbow+gray")
>
> res = True
> res@gsnMaximize = True
> res@gsnFrame = False
> res@gsnDraw = False
>
> res@cnFillOn = True
> res@cnFillMode = "CellFill"
> res@cnLinesOn = False
> res@cnLineLabelsOn = False
> res@cnLevelSelectionMode = "ExplicitLevels"
> res@cnLevels = (/.05,.1,.2,.4,.6,.8,1.0,1.2,1.5,2.0/)
> res@gsnSpreadColors = True
> res@gsnSpreadColorStart = 48
> res@gsnSpreadColorEnd = -1
>
> res@trGridType = "TriangularMesh"
>
> res@lbLabelAutoStride = True
> res@lbLabelFontHeightF = 0.012
> res@lbBoxLinesOn = False
> res@pmLabelBarWidthF = 0.55
> res@pmLabelBarHeightF = 0.06
> res@pmLabelBarOrthogonalPosF = 0.1
>
> res@mpDataBaseVersion = "MediumRes"
> res@mpOutlineBoundarySets = "AllBoundaries"
> res@mpNationalLineThicknessF = 0.5
> res@mpGeophysicalLineThicknessF = 0.5
>
> res@tmYRLabelsOn = True
> res@tmXTLabelsOn = True
> res@tmXBLabelFontHeightF = 0.012
> res@tmXBTickSpacingF = 5
> res@tmYLTickSpacingF = 5
> res@tmXBMode = "Explicit"
> res@tmXBMinorValues = ispan(40,80,1)
> res@tmYLMode = "Explicit"
> res@tmYLMinorValues = ispan(30,55,1)
>
> res@mpFillOn = False
> res@tfDoNDCOverlay = True
> res@gsnAddCyclic = False
>
> res@mpProjection = "CylindricalEquidistant"
> res@mpLimitMode = "LatLon"
> res@mpMinLatF = latS
> res@mpMaxLatF = latN
> res@mpMinLonF = lonL
> res@mpMaxLonF = lonR
> res@mpGridAndLimbOn = True
> res@mpCenterLonF = 60.0
> res@mpCenterLatF = 42.0
>
> plot = gsn_csm_contour_map(wks,aod550,res)
>
> draw(plot)
> frame(wks)
>
>
>
> _______________________________________________
> ncl-talk mailing list
> List instructions, subscriber options, unsubscribe:
> http://mailman.ucar.edu/mailman/listinfo/ncl-talk
>
------------------------------
Message: 3
Date: Fri, 19 Oct 2012 14:27:30 -0600
From: Dennis Shea <shea@ucar.edu>
Subject: Re: how to use loop to read in multiple nc files
To: kdeng1@slu.edu
Cc: ncl-talk@ucar.edu
Message-ID: <5081B7B2.3060407@ucar.edu>
Content-Type: text/plain; charset=UTF-8; format=flowed
To loop over files ...
[1] fils_r = systemfunc("ls rhum.*.nc")
fils_u =
fils_v =
nfils = dimsizes(filsr)
f1 = addfiles("rhum.*.nc","r")
f2 = addfiles("uwnd.*.nc","r")
f3 = addfiles("vwnd.*.nc","r")
do nf=0,nfils-1 ; loop over each file
r = short2flt( f[nf]->rhum )
u = short2flt( f[nf]->u(:,0:7,:,:) )
v
delete([/ r, u, v /]) ; may change size
end if
[2] Replace
qint = dim_sum_Wrap(q(time|:,lat|:,lon|:,level|:))
with
qint = dim_sum_Wrap(q,1) ; less memory intensive
Replace
Qint = dim_sum_Wrap(qint,0)
With
On 10/19/12 11:55 AM, Soumik Basu wrote:
> You can try something like this :
>
> ***********************************************
> load "$NCARG_ROOT/lib/ncarg/nclscripts/csm/gsn_code.ncl"
> load "$NCARG_ROOT/lib/ncarg/nclscripts/csm/gsn_csm.ncl"
> load "$NCARG_ROOT/lib/ncarg/nclscripts/csm/contributed.ncl"
> ;***********************************************
> ;begin
> ;***********************************************
> ;read in netCDF file
> ;***********************************************
>
> do yy = 1948, 2007 ; Start the year loop
>
> f1 = addfiles("rhum."+yy+".nc","r")
> f2 = addfiles("uwnd."+yy+".nc","r")
> f3 = addfiles("vwnd."+yy+".nc","r")
> rhum = f1->rhum(:,:,:,:)
> q = rhum/100+302.66
> copy_VarCoords(rhum,q)
> uwnd = f2->uwnd(:,0:7,:,:)
> u = uwnd/100+202.66
> copy_VarCoords(uwnd,u)
> vwnd = f3->vwnd(:,0:7,:,:)
> v = vwnd/100+202.66
> copy_VarCoords(vwnd,v)
>
> qu=q*u
> qv=q*v
> copy_VarCoords(q,qu)
> copy_VarCoords(q,qv)
>
> g = 9.81
> q = qu+qv
> copy_VarCoords(qu,q)
>
> qint = dim_sum_Wrap(q(time|:,lat|:,lon|:,level|:))
> ;*integration*******
> Qint = dim_sum_Wrap(qint(lat|:,lon|:,time|:))
> Qint = (Qint/g) ;***********weight by
> gravity****************
> Qint@units = "kg/ms"
>
> end do ; end year loop
>
> ;************************************
> ; create the plot1
> ;************************************
> wks=gsn_open_wks("ps","q")
>
> res = True ; plot mods desired
> res@tiMainString = "vertical integrated moisture transport"
> ; main title
> res@cnFillOn = True ; turn on color fill
> plot = gsn_csm_contour_map(wks,Qint(:,:),res)
>
> end
>
>
> On 2012-10-19 09:25, Ke Deng wrote:
>> Dear all,
>> I am computing the vertical integrated moisture transport (this is
>> not the point) and get the right code for that. But now I meet with
>> one problem. The data I use now are rhum.****.nc uwnd.****.nc
>> vwnd.****.nc yearly data.(60 nc files for each one so 180 nc files
>> totally) The below code is useful for one year data so the code is
>> absolutely right. But now I want to compute the moisture transport
>> over 60 years (1948-2007). At first I used the ncrcat command in
>> linux
>> to integrate the 60 nc files into one file but when I run the code it
>> displayed the segmentation fault. And then I used the command
>> systemfunc and addfiles in ncl to process that and also show some
>> errors. So the only reason is there are too many files and the
>> software can not see them as one big file to process. Now I am stuck
>> here and don't know how to write one loop to solve that. Please your
>> response will be appreciated! Thank u!
>>
>> ;***********************************************
>> load "$NCARG_ROOT/lib/ncarg/nclscripts/csm/gsn_code.ncl"
>> load "$NCARG_ROOT/lib/ncarg/nclscripts/csm/gsn_csm.ncl"
>> load "$NCARG_ROOT/lib/ncarg/nclscripts/csm/contributed.ncl"
>> ;***********************************************
>> ;begin
>> ;***********************************************
>> ;read in netCDF file
>> ;***********************************************
>> f1 = addfiles("rhum.1977.nc [2]","r")
>> f2 = addfiles("uwnd.1977.nc [3]","r")
>> f3 = addfiles("vwnd.1977.nc [4]","r")
>> rhum = f1->rhum(:,:,:,:)
>> q = rhum/100+302.66
>> copy_VarCoords(rhum,q)
>> uwnd = f2->uwnd(:,0:7,:,:)
>> u = uwnd/100+202.66
>> copy_VarCoords(uwnd,u)
>> vwnd = f3->vwnd(:,0:7,:,:)
>> v = vwnd/100+202.66
>> copy_VarCoords(vwnd,v)
>>
>> qu=q*u
>> qv=q*v
>> copy_VarCoords(q,qu)
>> copy_VarCoords(q,qv)
>>
>> g = 9.81
>> q = qu+qv
>> copy_VarCoords(qu,q)
>>
>> qint = dim_sum_Wrap(q(time|:,lat|:,lon|:,level|:))
>> ;*integration*******
>> Qint = dim_sum_Wrap(qint(lat|:,lon|:,time|:))
>> Qint = (Qint/g) ;***********weight by
>> gravity****************
>> Qint@units = "kg/ms"
>> ;************************************
>> ; create the plot1
>> ;************************************
>> wks=gsn_open_wks("ps","q")
>>
>> res = True ; plot mods desired
>> res@tiMainString = "vertical integrated moisture
>> transport" ; main title
>> res@cnFillOn = True ; turn on color fill
>> plot = gsn_csm_contour_map(wks,Qint(:,:),res)
>>
>> end
>>
>>
>>
>> Links:
>> ------
>> [1] http://rhum.1977.nc
>> [2] http://uwnd.1977.nc
>> [3] http://vwnd.1977.nc
>>
>> _______________________________________________
>> ncl-talk mailing list
>> List instructions, subscriber options, unsubscribe:
>> http://mailman.ucar.edu/mailman/listinfo/ncl-talk
>
------------------------------
_______________________________________________
ncl-talk mailing list
ncl-talk@ucar.edu
http://mailman.ucar.edu/mailman/listinfo/ncl-talk
End of ncl-talk Digest, Vol 107, Issue 28
*****************************************
_______________________________________________
ncl-talk mailing list
List instructions, subscriber options, unsubscribe:
http://mailman.ucar.edu/mailman/listinfo/ncl-talk
Received on Sun Oct 21 20:05:49 2012
This archive was generated by hypermail 2.1.8 : Tue Oct 23 2012 - 11:10:04 MDT