unsubscribe
On Oct 19, 2012, at 2:00 PM, ncl-talk-request@ucar.edu wrote:
> Send ncl-talk mailing list submissions to
> ncl-talk@ucar.edu
>
> To subscribe or unsubscribe via the World Wide Web, visit
> http://mailman.ucar.edu/mailman/listinfo/ncl-talk
> or, via email, send a message with subject or body 'help' to
> ncl-talk-request@ucar.edu
>
> You can reach the person managing the list at
> ncl-talk-owner@ucar.edu
>
> When replying, please edit your Subject line so it is more specific
> than "Re: Contents of ncl-talk digest..."
>
>
> Today's Topics:
>
> 1. Re: Cross-section plots (Dennis Shea)
> 2. Re: FW: I mean regridding the data to a rectiliniear lat /
> lon grid (Dennis Shea)
> 3. Re: Why min/max are different from the actual range? (Dennis Shea)
> 4. Re: Cross-section plots (astroqing)
> 5. Re: Why min/max are different from the actual range? (Wen.J.Qu)
> 6. Re: Opacity in contour plot (brownrig@ucar.edu)
> 7. Re: Cross-section plots (Dennis Shea)
> 8. Re: boxplot (Adam Phillips)
> 9. how to use loop to read in multiple nc files (Ke Deng)
> 10. Re: how to use loop to read in multiple nc files (Soumik Basu)
>
>
> ----------------------------------------------------------------------
>
> Message: 1
> Date: Fri, 19 Oct 2012 07:14:37 -0600
> From: Dennis Shea <shea@ucar.edu>
> Subject: Re: Cross-section plots
> To: astroqing <astroqing@gmail.com>
> Cc: ncl-talk <ncl-talk@ucar.edu>
> Message-ID: <5081523D.1080908@ucar.edu>
> Content-Type: text/plain; charset=ISO-8859-1; format=flowed
>
> Please look at the Examples page:
> http://www.ncl.ucar.edu/Applications/
>
> Under 'Plot Types'
>
> Press/height vs. latitude
> Press/height vs. longitude
> Press/height vs. time
>
> If you need an arbitrary cross section, see
>
> http://www.ncl.ucar.edu/Document/Functions/Contributed/linint2_points_Wrap.shtml
>
> Cross sections are just regular contour plots wher
>
> y -> {height, pressure, depth}
> x -> {lat,lon,time}
>
> ================================================
>
> If you are "new to NCL", please read the mini-Language manual at
>
> http://www.ncl.ucar.edu/Document/Manuals/
>
>
>
> On 10/19/12 12:43 AM, astroqing wrote:
>> Hi,
>> I am new to NCL and I want to
>> draw cross-section plots with Ncep Reanalysis data which is in lat/lon
>> projection.
>> I only find the sample scripts used to draw WRF output with the
>> functions wrf_user_intrp3d( ) to interpolate variable horizontally, and
>> it can not be used in Ncep data.
>> So I am writing to ask if you can help and tell me how to solve the problem?
>> Thanks a lot!
>> Tao Qing
>> 2012-10-19
>> ------------------------------------------------------------------------
>>
>>
>> _______________________________________________
>> ncl-talk mailing list
>> List instructions, subscriber options, unsubscribe:
>> http://mailman.ucar.edu/mailman/listinfo/ncl-talk
>>
>
>
> ------------------------------
>
> Message: 2
> Date: Fri, 19 Oct 2012 07:20:27 -0600
> From: Dennis Shea <shea@ucar.edu>
> Subject: Re: FW: I mean regridding the data to a
> rectiliniear lat / lon grid
> To: Ping Yang <pyang@ccny.cuny.edu>
> Cc: ncl-talk@ucar.edu
> Message-ID: <5081539B.30903@ucar.edu>
> Content-Type: text/plain; charset=UTF-8; format=flowed
>
> You want to regrid.
>
> The Lambert Conformal is 'curvilinear grid' and you want to
> regrid to a 'rectilinear grid'. There are numerous examples on
> the 'ESMF Regrid' page
>
> http://www.ncl.ucar.edu/Applications/ then "ESMF Regridding"
>
> Examples 5 and 8 couls serve as a basis for your needs
>
>
> On 10/18/12 9:48 PM, Ping Yang wrote:
>> Hi David,
>>
>> I am just following on a previous posted topic related to Lambert
>> Conformal Conic grid, I plan to re-project (or regrid) a grid data which
>> has the following information:
>>
>> dimensions:
>> x = 189 ;
>> y = 227 ;
>> time = 365 ;
>> nv = 2 ;
>> variables:
>> short lambert_conformal_conic ;
>> lambert_conformal_conic:grid_mapping_name = "lambert_conformal_conic" ;
>> lambert_conformal_conic:longitude_of_central_meridian = -100. ;
>> lambert_conformal_conic:latitude_of_projection_origin = 42.5 ;
>> lambert_conformal_conic:false_easting = 0. ;
>> lambert_conformal_conic:false_northing = 0. ;
>> lambert_conformal_conic:standard_parallel = 25., 60. ;
>> double x(x) ;
>> x:units = "m" ;
>> x:long_name = "x coordinate of projection" ;
>> x:standard_name = "projection_x_coordinate" ;
>> double y(y) ;
>> y:units = "m" ;
>> y:long_name = "y coordinate of projection" ;
>> y:standard_name = "projection_y_coordinate" ;
>> double time(time) ;
>> time:long_name = "time" ;
>> time:calendar = "standard" ;
>> time:units = "days since 1980-01-01 00:00:00 UTC" ;
>> time:bounds = "time_bnds" ;
>> double lat(y, x) ;
>> lat:units = "degrees_north" ;
>> lat:long_name = "latitude coordinate" ;
>> lat:standard_name = "latitude" ;
>> double lon(y, x) ;
>> lon:units = "degrees_east" ;
>> lon:long_name = "longitude coordinate" ;
>> lon:standard_name = "longitude" ;
>> short yearday(time) ;
>> yearday:long_name = "yearday" ;
>> yearday:valid_range = 1s, 365s ;
>> float prcp(time, y, x) ;
>> prcp:long_name = "daily total precipitation" ;
>> prcp:units = "mm/day" ;
>> prcp:missing_value = -9999.f ;
>> prcp:_FillValue = -9999.f ;
>> prcp:valid_range = 0.f, 200.f ;
>> prcp:coordinates = "lat lon" ;
>> prcp:grid_mapping = "lambert_conformal_conic" ;
>> prcp:cell_methods = "area: sum time: sum" ;
>> double time_bnds(time, nv) ;
>>
>> I need to do the following:
>>
>> 1) change the projection into lat/lon
>> 2)regrid the data from higher resolution into lower resolution(aggregating)
>>
>> I am asking which will be the first to do and how can I do
>> it(lambert_conformal_conic to lon/lat).
>>
>> Looking forward to hearing from you.
>>
>> Best Regards
>>
>> Ping
>>
>>
>>
>> On Fri, Aug 10, 2012 at 4:00 PM, David Brown <dbrown@ucar.edu
>> <mailto:dbrown@ucar.edu>> wrote:
>>
>> Hi Gualberto,
>> I am enclosing a modified version of the script that uses NCL to
>> generate the 2D lat/lon coordinate arrays and write them to a file.
>> To demonstrate their correctness, it uses them to
>> transform the data into an orthographic projection. You can use the
>> lat/lon arrays to perform the re-gridding, step 4 of the process
>> outlined by Dave Allured. For that I recommend studying the
>> ESMF regridding examples at
>> http://www.ncl.ucar.edu/Applications/ESMF.shtml. You will need NCL
>> 6.1.0-beta if you don't have it already. I also am attaching the
>> orthographic plot.
>> -dave
>>
>>
>>
>>
>> On Aug 9, 2012, at 11:41 PM, Gualberto Hern?ndez Ju?rez wrote:
>>
>>> Dave,
>>>
>>> I offer youexcuseforlatereply,
>>>
>>> So I understandwith the file yousent me"lcnative.ncl"I can nowrun
>>> theregridding?
>>>
>>> You will havesomevery basicexamplethat can serve asreferenceto do
>>> it?I supposeI have to useESMF.
>>>
>>> Thanks,
>>> Gualberto
>>>
>>> ------------------------------------------------------------------------
>>> Subject: Re: FW: I mean regridding the data to a
>>> rectiliniear lat / lon grid
>>> From:dbrown@ucar.edu <mailto:dbrown@ucar.edu>
>>> Date: Thu, 9 Aug 2012 17:02:01 -0600
>>> CC:ncl-talk@ucar.edu <mailto:ncl-talk@ucar.edu>
>>> To:betoic@hotmail.com <mailto:betoic@hotmail.com>
>>>
>>> Hi Gualberto,
>>> I have figured out what I think are the correct (or at least close
>>> enough) parameters to get the right results from the PROJ4 tool. I
>>> think the main issue I was having is that the Lambert Conformal
>>> Conic projection has a singularity over the equator, because it
>>> ceases to be conic and becomes a cylinder. At least NCL does not
>>> work with a single parallel set to 0.0. However, I can make it
>>> work using 2 standard parallels very close to each other (0.0 and
>>> 0.01). The PROJ4 tool does not give up, but the numbers were wrong
>>> if you do not do something similar. Anyway it would now be
>>> possible to generate the 2d lat/lon arrays that you will need for
>>> re-gridding, either just using PROJ4 or by sampling the projected
>>> space in NCL. I am attaching a plot of temperature that I think
>>> shows the map boundaries aligning very well with the data. I also
>>> include the version of the script that created it.
>>> -dave
>>>
>>>
>>>
>>> On Aug 8, 2012, at 1:47 PM, Gualberto Hern?ndez Ju?rez wrote:
>>>
>>> I have not done, mainly becauseArcGisalsolimitedinNetCDFformat
>>>
>>> ------------------------------------------------------------------------
>>> From:dbrown@ucar.edu <mailto:dbrown@ucar.edu>
>>> Subject: Re: FW: I mean regridding the data to a
>>> rectiliniear lat / lon grid
>>> Date: Wed, 8 Aug 2012 12:46:30 -0600
>>> To:betoic@hotmail.com <mailto:betoic@hotmail.com>
>>>
>>> One question: Can you find out the projection parameters
>>> and/or the corner lat/lon values using ArcGIS?
>>> -dave
>>>
>>> On Aug 8, 2012, at 12:35 PM, Gualberto Hern?ndez Ju?rez wrote:
>>>
>>>
>>> Dave,
>>>
>>> This is howI see itinArcGIS,correspondsto the same
>>> variableMSLP.As yousaidthe picture yousent meisa little shaky.
>>>
>>> Gualberto.
>>>
>>>
>>> ------------------------------------------------------------------------
>>> From:dbrown@ucar.edu <mailto:dbrown@ucar.edu>
>>> Subject: Re: FW: I mean regridding the data to
>>> a rectiliniear lat / lon grid
>>> Date: Wed, 8 Aug 2012 11:17:02 -0600
>>> To:betoic@hotmail.com <mailto:betoic@hotmail.com>
>>>
>>> I was hoping for an image with the continental boundaries
>>> correctly placed. To show you what I mean here is the best
>>> I have been able to do using NCL. The trick is to figure
>>> out the correct projection parameters and the lat/lon
>>> locations of the lower left and upper right corner points.
>>> I did this using the PROJ4 projection tool (similar in
>>> capabilities to the tool Dave Allured recommended -- MPS
>>> Geotrans). But I am not sure I got the right values
>>> because it looks to me like the data does not quite fit
>>> the map outlines. I would not trust any re-gridding
>>> operation if I could not first get the the map outlines
>>> correctly placed. It looks to me (based on plotting a
>>> number of the pressure and temperature time steps) that
>>> the lower part of Mexico and Central America is skewed to
>>> the right and that not so much of South America should be
>>> visible. Anyway so you know what I am talking about I am
>>> attaching the plot I came up with in NCL. Also the script
>>> as it exists now. Perhaps you have access to more
>>> information about the projection parameters?
>>> -dave
>>>
>>>
>>>
>>>
>>> On Aug 7, 2012, at 8:20 PM, Gualberto Hern?ndez Ju?rez wrote:
>>>
>>>
>>>
>>> Dave,
>>> I send the image
>>> ------------------------------------------------------------------------
>>> From:dbrown@ucar.edu <mailto:dbrown@ucar.edu>
>>> Subject: Re: FW: I mean regridding the data
>>> to a rectiliniear lat / lon grid
>>> Date: Tue, 7 Aug 2012 18:16:24 -0600
>>> To:betoic@hotmail.com <mailto:betoic@hotmail.com>
>>>
>>> Sorry maybe I misunderstand. I have the NetCDF
>>> file MMOUT_DOMAIN1.nc. But I thought you said you
>>> uploaded an image (picture ??) of the plot you made in
>>> ArcMap. I would like to see the picture if you can
>>> send it.
>>> -dave
>>>
>>> On Aug 7, 2012, at 5:23 PM, Gualberto Hern?ndez Ju?rez
>>> wrote:
>>>
>>> This is the fileMMOUT_DOMAIN1.nc
>>>
>>> The fileyou put inplace it
>>> ftp://ftp.cgd.ucar.edu/incoming/
>>>
>>>
>>> ------------------------------------------------------------------------
>>> From:dbrown@ucar.edu <mailto:dbrown@ucar.edu>
>>> Subject: Re: FW: I mean regridding the
>>> data to a rectiliniear lat / lon grid
>>> Date: Tue, 7 Aug 2012 17:19:16 -0600
>>> To:betoic@hotmail.com <mailto:betoic@hotmail.com>
>>>
>>> (offline)
>>> I need to know what you called the file in order
>>> to retrieve it.
>>> -dave
>>>
>>> On Aug 7, 2012, at 5:10 PM, Gualberto Hern?ndez
>>> Ju?rez wrote:
>>>
>>> Thanks for your replyDave,
>>>
>>> Iplotthe fileonly inArcMap ofArcGIS, place an
>>> imageinthe directory:
>>>
>>>
>>> ftp://ftp.cgd.ucar.edu/incoming/
>>>
>>>
>>> I just have toput the mapof the Mexican republic.
>>>
>>>
>>> ------------------------------------------------------------------------
>>> Subject: Re: FW: I mean regridding
>>> the data to a rectiliniear lat / lon grid
>>> From:dbrown@ucar.edu <mailto:dbrown@ucar.edu>
>>> Date: Tue, 7 Aug 2012 16:41:41 -0600
>>> CC:ncl-talk@ucar.edu <mailto:ncl-talk@ucar.edu>
>>> To:betoic@hotmail.com <mailto:betoic@hotmail.com>
>>>
>>> Hi Gaulberto,
>>> Here is a way to write the text file as X/Y
>>> pairs as Dave Allured suggested:
>>>
>>> f = addfile ("MMOUT_DOMAIN1.nc", "r")
>>> x = f->lon
>>> y = f->lat
>>> nx = dimsizes(x)
>>> ny = dimsizes(y)
>>> x2d = conform_dims((/ny,nx/),x,1)
>>> y2d = conform_dims((/ny,nx/),y,0)
>>> outstr = sprintf("%9.3f",x2d) + " " +
>>> sprintf("%9.3f",y2d)
>>> asciiwrite("xy.txt",outstr)
>>>
>>> I wonder if you have a plot of this grid in
>>> its native (Lambert Conformal) configuration.
>>> I have tried to plot it based on the LC
>>> parameters given in the data file, but so far
>>> I have been unsuccessful.
>>> A correct plot of the domain would help.
>>>
>>> If you can get NCL to plot the data correctly
>>> in its native projection, then it is possible
>>> to compute the lat/lon coordinates using NCL
>>> by itself.
>>> -dave
>>>
>>>
>>> On Aug 7, 2012, at 2:06 PM, Gualberto
>>> Hern?ndez Ju?rez wrote:
>>>
>>> Dave,
>>> How to make the text file, which you
>>> mention in the first point.
>>>
>>> Thanks
>>> Gualberto
>>>
>>>> Date: Tue, 7 Aug 2012 11:44:09 -0600
>>>> Subject: Re: I mean regridding the data to a rectiliniear lat / lon grid
>>>> From:dave.allured@noaa.gov
>>> <mailto:dave.allured@noaa.gov>
>>>> To:betoic@hotmail.com <mailto:betoic@hotmail.com>
>>>> CC:ncl-talk@ucar.edu <mailto:ncl-talk@ucar.edu>
>>>>
>>>> Here is one way. I am sure there are others.
>>>>
>>>> 1. Use NCL to make a text file containing a 1-dimensional ordered
>>>> list of all X/Y coordinate pairs.
>>>>
>>>> 2. Use MPS Geotrans in batch mode to translate the list of
>>>> coordinates from Lambert Conformal to terrestrial lat/lon. It's free
>>>> software, and it supports a huge variety of known terrestrial
>>>> coordinate systems.
>>>>
>>>> http://earth-info.nga.mil/GandG/geotrans/
>>>>
>>>> 3. Use NCL to read in the translated coordinates, and reshape them
>>>> into 2-D lat and lon coordinate arrays.
>>>>
>>>> 4. Use one of the many NCL regridding functions, plus the 2-D
>>>> coordinates from step 3, to regrid the data array to a rectilinear
>>>> grid of your choice.
>>>>
>>>> This is an overview. Steps 1 and 3 are fairly straightforward NCL
>>>> coding. Steps 2 and 4 will involve significant study to get them
>>>> working correctly. HTH.
>>>>
>>>> --Dave
>>>>
>>>> On Tue, Aug 7, 2012 at 10:54 AM, Gualberto Hern?ndez Ju?rez
>>>> <betoic@hotmail.com
>>> <mailto:betoic@hotmail.com>> wrote:
>>>>> I need *regrid* the 2D lat/lon to a rectilinear lat lon.
>>>>>
>>>>> any comments will be grateful enough support, I'm new to NCL.
>>>>>
>>>>> Thank you,
>>>>> Gualberto
>>>>>
>>>>>
>>>>>> Date: Tue, 7 Aug 2012 10:41:42 -0600
>>>>>> From:shea@ucar.edu <mailto:shea@ucar.edu>
>>>>>> To:betoic@hotmail.com <mailto:betoic@hotmail.com>
>>>>>> CC:ncl-talk@ucar.edu <mailto:ncl-talk@ucar.edu>
>>>>>> Subject: Re: I mean regridding the data to a rectiliniear lat /
>>>>>> lon grid
>>>>>>
>>>>>> Technically, this is already a rectilinear grid.
>>>>>>
>>>>>> double lat ( lat )
>>>>>> _CoordinateAxisType : GeoY
>>>>>> axis : Y
>>>>>> grid_spacing : 27.0 km
>>>>>> long_name : y coordinate of projection
>>>>>> standard_name : projection_y_coordinate
>>>>>> units : km
>>>>>>
>>>>>> double lon ( lon )
>>>>>> _CoordinateAxisType : GeoX
>>>>>> axis : X
>>>>>> grid_spacing : 27.0 km
>>>>>> long_name : x coordinate of projection
>>>>>> standard_name : projection_x_coordinate
>>>>>> units : km
>>>>>>
>>>>>> float u10 ( time, lat, lon )
>>>>>> long_name : 10 m u wind (m/sec)
>>>>>> _FillValue : -9999
>>>>>> grid_mapping : Lambert_Conformal
>>>>>>
>>>>>> The issue is that the poorly named 'lat' and 'lon' variables
>>>>>> should be (say) 'y' and 'x'.
>>>>>>
>>>>>> Basically, the projection information
>>>>>>
>>>>>> character Lambert_Conformal ( ncl_scalar )
>>>>>> grid_mapping_name : lambert_conformal_conic
>>>>>> long_name :
>>>>>> latitude_of_projection_origin : 0
>>>>>> longitude_of_central_meridian : -124.17
>>>>>> false_easting : 0
>>>>>> false_northing : -27
>>>>>> standard_parallel : 0
>>>>>> _CoordinateTransformType : Projection
>>>>>> _CoordinateAxisTypes : GeoX GeoY
>>>>>> earth_shape : Earth spherical with radius of 6,371,229.0 m
>>>>>> earth_radius : 6371229
>>>>>>
>>>>>> must be used to generate two-dimensional latitude and longitude
>>>>>> coordinates for each grid point. Then the data can be plotted on the
>>>>>> lambert map projection. Is this what you want?
>>>>>>
>>>>>> *** I have no idea how to do this. Maybe someone else does. ***
>>>>>>
>>>>>> Then, if you really want to *regrid* the 2D lat/lon to a rectilinear
>>>>>> lat lon, you would have to use the ESMF regridding
>>>>>> http://www.ncl.ucar.edu/Applications/ESMF.shtml
>>>>>>
>>>>>>
>>>>>> On 8/7/12 10:12 AM, Gualberto Hern?ndez Ju?rez wrote:
>>>>>>> Hi,
>>>>>>>
>>>>>>> I mean regridding the data to a rectiliniear lat / lon grid
>>>>>>>
>>>>>>> locate the file in the directory:
>>>>>>>
>>>>>>> ftp://ftp.cgd.ucar.edu/incoming/
>>>>>>>
>>>>>>> or you can download from this link:
>>>>>>>
>>>>>>> https://dl.dropbox.com/u/96409134/MMOUT_DOMAIN1.nc
>>>>>>>
>>>>>>> Thanks I'll be awaiting your response.
>>>>>>> Gualberto
>>> _______________________________________________
>>> ncl-talk mailing list
>>> List instructions, subscriber options,
>>> unsubscribe:
>>> http://mailman.ucar.edu/mailman/listinfo/ncl-talk
>>>
>>>
>>> _______________________________________________
>>> ncl-talk mailing list
>>> List instructions, subscriber options,
>>> unsubscribe:
>>> http://mailman.ucar.edu/mailman/listinfo/ncl-talk
>>>
>>>
>>>
>>>
>>> <Huracan
>>> Bud.jpg>_______________________________________________
>>> ncl-talk mailing list
>>> List instructions, subscriber options, unsubscribe:
>>> http://mailman.ucar.edu/mailman/listinfo/ncl-talk
>>>
>>>
>>> <PresionSNivelMar23-05-2012_4-00pm.jpg>_______________________________________________
>>> ncl-talk mailing list
>>> List instructions, subscriber options, unsubscribe:
>>> http://mailman.ucar.edu/mailman/listinfo/ncl-talk
>>>
>>>
>>> _______________________________________________
>>> ncl-talk mailing list
>>> List instructions, subscriber options, unsubscribe:
>>> http://mailman.ucar.edu/mailman/listinfo/ncl-talk
>>>
>>>
>>>
>>
>>
>> _______________________________________________
>> ncl-talk mailing list
>> List instructions, subscriber options, unsubscribe:
>> http://mailman.ucar.edu/mailman/listinfo/ncl-talk
>>
>> --
>> Ping Yang, Ph.D.
>> CUNY Environmental Crossroads Initiative
>> Marshak Science Building - Suite 925
>> The City College of New York - CUNY
>> 160 Convent Avenue, New York NY 10031
>> Phone: 212-650-5769
>> Fax: 212-650-7064
>>
>>
>> <http://mailman.ucar.edu/mailman/listinfo/ncl-talk>
>>
>>
>> _______________________________________________
>> ncl-talk mailing list
>> List instructions, subscriber options, unsubscribe:
>> http://mailman.ucar.edu/mailman/listinfo/ncl-talk
>>
>
>
> ------------------------------
>
> Message: 3
> Date: Fri, 19 Oct 2012 07:28:36 -0600
> From: Dennis Shea <shea@ucar.edu>
> Subject: Re: Why min/max are different from the actual
> range?
> To: Wen.J.Qu@gmail.com
> Cc: ncl-talk <ncl-talk@ucar.edu>
> Message-ID: <50815584.40904@ucar.edu>
> Content-Type: text/plain; charset=ISO-8859-1; format=flowed
>
> This issue has been discussed many times on ncl-talk.
> See the FAQ and email archives.
> ==========
> As indicated, your data are type short.
> They also have a 'scale_factor' and 'add_offset'
>
> Variable: hgt
> Type: short
>
> add_offset : 32066
> scale_factor : 1
>
> These must be unpacked (unscaled) prior to use. The formula is
>
> unpacked_value = packed_value*scale_factor + add_offset
>
> NCL has a function located in contributed.ncl for this.
> It preserves all meta data.
>
> http://www.ncl.ucar.edu/Document/Functions/Contributed/short2flt.shtml
>
> load "$NCARG_ROOT/lib/ncarg/nclscripts/csm/contributed.ncl"
>
> hgt = short2flt( f->hgt(:,5,:,:) )
>
>
>
> On 10/19/12 12:52 AM, Wen.J.Qu wrote:
>> Hi, all
>> When I read a .nc file, printVarSummary shows the 3D variable "hgt" has
>> an actual range of "-527, 32307 "
>> But when I use the line {print("hgt min/max = " + min(hgt) + "/"
>> + max(hgt))} to print the min and max, it shows "hgt min/max =
>> -27627/-26066"
>> Please help me to give some hint about the problem of this code. Is it
>> from my calculation of min and max with the "short" data type? Is it
>> from the wrong setting of the missing value? Or is it from my probably
>> some wrong in reading the .nc file?
>> Thanks a lot in advance.
>> Shawn
>> ##############################################################
>> code
>> ##############################################################
>> fil = systemfunc ("cd " + diri + " ; ls hgt."+YEAR+".nc")
>> f = addfile(diri+fil,"r")
>> ;Debugprint
>> printVarSummary(f)
>> hgt = f->hgt(:,5,:,:)
>> ;Debugprint
>> printVarSummary(hgt)
>> print("hgt min/max = " + min(hgt) + "/" + max(hgt))
>> ##############################################################
>> ##############################################################
>> print result
>> ##############################################################
>> Variable: hgt
>> Type: short
>> Total Size: 7673760 bytes
>> 3836880 values
>> Number of Dimensions: 3
>> Dimensions and sizes: [time | 365] x [lat | 73] x [lon | 144]
>> Coordinates:
>> time: [17373888..17382624]
>> lat: [90..-90]
>> lon: [ 0..357.5]
>> Number Of Attributes: 19
>> level : 500
>> long_name : mean Daily Geopotential height
>> actual_range : ( -527, 32307 )
>> unpacked_valid_range : ( -700, 35000 )
>> units : m
>> add_offset : 32066
>> scale_factor : 1
>> missing_value : 32766
>> precision : 0
>> least_significant_digit : 0
>> GRIB_id : 7
>> GRIB_name : HGT
>> var_desc : Geopotential height
>> dataset : NCEP Reanalysis Daily Averages
>> level_desc : Multiple levels
>> statistic : Mean
>> parent_stat : Individual Obs
>> valid_range : ( -32766, 2934 )
>> _FillValue : 32766
>> (0) hgt min/max = -27627/-26066
>> ##############################################################
>> ------------------------------------------------------------------------
>> Wen.J.Qu
>> 2012-10-19
>>
>>
>> _______________________________________________
>> ncl-talk mailing list
>> List instructions, subscriber options, unsubscribe:
>> http://mailman.ucar.edu/mailman/listinfo/ncl-talk
>>
>
>
> ------------------------------
>
> Message: 4
> Date: Fri, 19 Oct 2012 22:25:07 +0800
> From: "astroqing" <astroqing@gmail.com>
> Subject: Re: Cross-section plots
> To: "Dennis Shea" <shea@ucar.edu>
> Cc: ncl-talk <ncl-talk@ucar.edu>
> Message-ID: <50816262.0288440a.0cad.ffff85d9@mx.google.com>
> Content-Type: text/plain; charset="utf-8"
>
> Thanks for your reply. I have read the introduction of function linint2_points_Wrap(), but still something i can not understand clearly.
> So if you can send me an example scripts about how to do arbitrary cross section, I will appreciate it very much.
> Best wishes!
>
> ------------------
>
> 2012-10-19
>
> -------------------------------------------------------------
> ????Dennis Shea <shea@ucar.edu>
> ?????2012-10-19 21:14
> ????astroqing
> ???ncl-talk
> ???Re: [ncl-talk] Cross-section plots
>
> Please look at the Examples page:
> http://www.ncl.ucar.edu/Applications/
>
> Under 'Plot Types'
>
> Press/height vs. latitude
> Press/height vs. longitude
> Press/height vs. time
>
> If you need an arbitrary cross section, see
>
> http://www.ncl.ucar.edu/Document/Functions/Contributed/linint2_points_Wrap.shtml
>
> Cross sections are just regular contour plots wher
>
> y -> {height, pressure, depth}
> x -> {lat,lon,time}
>
> ================================================
>
> If you are "new to NCL", please read the mini-Language manual at
>
> http://www.ncl.ucar.edu/Document/Manuals/
>
>
>
> On 10/19/12 12:43 AM, astroqing wrote:
>> Hi,
>> I am new to NCL and I want to
>> draw cross-section plots with Ncep Reanalysis data which is in lat/lon
>> projection.
>> I only find the sample scripts used to draw WRF output with the
>> functions wrf_user_intrp3d( ) to interpolate variable horizontally, and
>> it can not be used in Ncep data.
>> So I am writing to ask if you can help and tell me how to solve the problem?
>> Thanks a lot!
>> Tao Qing
>> 2012-10-19
>> ------------------------------------------------------------------------
>>
>>
>> _______________________________________________
>> ncl-talk mailing list
>> List instructions, subscriber options, unsubscribe:
>> http://mailman.ucar.edu/mailman/listinfo/ncl-talk
>>
>
>
> ------------------------------
>
> Message: 5
> Date: Fri, 19 Oct 2012 10:45:32 -0500
> From: "Wen.J.Qu" <wen.j.qu@gmail.com>
> Subject: Re: Why min/max are different from the actual
> range?
> To: "Dennis Shea" <shea@ucar.edu>
> Cc: ncl-talk <ncl-talk@ucar.edu>
> Message-ID: <201210191045321719476@gmail.com>
> Content-Type: text/plain; charset="gb2312"
>
> Thanks a lot, Dennis
>
> Your and Mary's prompt response to problems from new learners is extremely helpful.
>
> Forgive me to rise the question again because I do not know anything about it. There are too many things I need to learn before I can use NCL well.
>
> Thank you again and All my best wishes!
>
>
> Shawn
>
>
>
>
> Wen.J.Qu
> 2012-10-19
>
>
>
> ???? Dennis Shea
> ????? 2012-10-19 08:28:43
> ???? Wen.J.Qu@gmail.com
> ??? ncl-talk
> ??? Re: [ncl-talk] Why min/max are different from the actual range?
>
> This issue has been discussed many times on ncl-talk.
> See the FAQ and email archives.
> ==========
> As indicated, your data are type short.
> They also have a 'scale_factor' and 'add_offset'
>
> Variable: hgt
> Type: short
>
> add_offset : 32066
> scale_factor : 1
>
> These must be unpacked (unscaled) prior to use. The formula is
>
> unpacked_value = packed_value*scale_factor + add_offset
>
> NCL has a function located in contributed.ncl for this.
> It preserves all meta data.
>
> http://www.ncl.ucar.edu/Document/Functions/Contributed/short2flt.shtml
>
> load "$NCARG_ROOT/lib/ncarg/nclscripts/csm/contributed.ncl"
>
> hgt = short2flt( f- >hgt(:,5,:,:) )
>
>
>
> On 10/19/12 12:52 AM, Wen.J.Qu wrote:
>> Hi, all
>> When I read a .nc file, printVarSummary shows the 3D variable "hgt" has
>> an actual range of "-527, 32307 "
>> But when I use the line {print("hgt min/max = " + min(hgt) + "/"
>> + max(hgt))} to print the min and max, it shows "hgt min/max =
>> -27627/-26066"
>> Please help me to give some hint about the problem of this code. Is it
>> from my calculation of min and max with the "short" data type? Is it
>> from the wrong setting of the missing value? Or is it from my probably
>> some wrong in reading the .nc file?
>> Thanks a lot in advance.
>> Shawn
>> ##############################################################
>> code
>> ##############################################################
>> fil = systemfunc ("cd " + diri + " ; ls hgt."+YEAR+".nc")
>> f = addfile(diri+fil,"r")
>> ;Debugprint
>> printVarSummary(f)
>> hgt = f- >hgt(:,5,:,:)
>> ;Debugprint
>> printVarSummary(hgt)
>> print("hgt min/max = " + min(hgt) + "/" + max(hgt))
>> ##############################################################
>> ##############################################################
>> print result
>> ##############################################################
>> Variable: hgt
>> Type: short
>> Total Size: 7673760 bytes
>> 3836880 values
>> Number of Dimensions: 3
>> Dimensions and sizes: [time | 365] x [lat | 73] x [lon | 144]
>> Coordinates:
>> time: [17373888..17382624]
>> lat: [90..-90]
>> lon: [ 0..357.5]
>> Number Of Attributes: 19
>> level : 500
>> long_name : mean Daily Geopotential height
>> actual_range : ( -527, 32307 )
>> unpacked_valid_range : ( -700, 35000 )
>> units : m
>> add_offset : 32066
>> scale_factor : 1
>> missing_value : 32766
>> precision : 0
>> least_significant_digit : 0
>> GRIB_id : 7
>> GRIB_name : HGT
>> var_desc : Geopotential height
>> dataset : NCEP Reanalysis Daily Averages
>> level_desc : Multiple levels
>> statistic : Mean
>> parent_stat : Individual Obs
>> valid_range : ( -32766, 2934 )
>> _FillValue : 32766
>> (0) hgt min/max = -27627/-26066
>> ##############################################################
>> ------------------------------------------------------------------------
>> Wen.J.Qu
>> 2012-10-19
>>
>>
>> _______________________________________________
>> ncl-talk mailing list
>> List instructions, subscriber options, unsubscribe:
>> http://mailman.ucar.edu/mailman/listinfo/ncl-talk
>>
> -------------- next part --------------
> An HTML attachment was scrubbed...
> URL: http://mailman.ucar.edu/pipermail/ncl-talk/attachments/20121019/29420d90/attachment.html
>
> ------------------------------
>
> Message: 6
> Date: Fri, 19 Oct 2012 10:47:22 -0600
> From: <brownrig@ucar.edu>
> Subject: Re: Opacity in contour plot
> To: "imran nadeem" <qphoton@gmail.com>, <ncl-talk@ucar.edu>
> Message-ID: <web-42874045@mail.ucar.edu>
> Content-Type: text/plain;charset=utf-8; format="flowed"
>
> On Fri, 19 Oct 2012 11:17:08 +0200
> Hi Nadeem,
>
> I will look into this first thing next week and get back with you...
>
> Rick
>
> imran nadeem <qphoton@gmail.com> wrote:
>> Dear NCL-developers,
>>
>> I confirm the problem is coming from very "twisty" contours
>> drawn in a small area. I tried to enlarge my plots, but still
>> getting
>> ARSCAM/ARPRAM error.
>> For me the best solution is that cnFillOpacityF works for RasterFill
>> or CellFilll because ARSCAM/ARPRAM error doesn't occur for these
>> contour fill types.
>> In separate email, I sent data + script to Mary for possible fix.
>>
>> Regards
>> Nadeem
>>
>>
>> On Wed, Oct 17, 2012 at 4:35 PM, Mary Haley <haley@ucar.edu> wrote:
>>> Hi Nadeem,
>>>
>>> We are trying to fix the contouring code so that users don't run
>>> into the ARSCAM/ARPRAM error.
>>> Do you still get an image, by any chance? Sometimes you just get a
>>> plot with no data in it.
>>>
>>> To help make this error go away, sometimes making the plot slightly
>>> larger will help. The error
>>> shows up sometimes when you have very "twisty" contours that are
>>> being drawn in a small area.
>>> If you make the plot slightly larger, this can help. We see this
>>> error more when people are
>>> panelling plots. Is that what you're doing here?
>>>
>>> If so, and if I can see a sample image, then I might be able to
>>> suggest ways to make the plots larger.
>>>
>>> Even better, if you can provide me with your data and your script,
>>> then I can try to reproduce the
>>> problem here and see if there's an easy fix. You can ftp your
>>> script and data . See:
>>>
>>> http://www.ncl.ucar.edu/report_bug.shtml#HowToFTP
>>>
>>> Hopefully Rick or Dave will address your question about
>>> cnFillOpacityF not working with
>>> RasterFill or CellFill.
>>>
>>> --Mary
>>>
>>>
>>>
>>> On Oct 17, 2012, at 7:32 AM, imran nadeem wrote:
>>>
>>>> Dear All,
>>>> I am using NCL verion 6.1.0-beta to make partially transparent
>>>> contour plots. For me, the resource "cnFillOpacityF" works only with
>>>> cnFillMode = "AreaFill". It doesn't have any effect on RasterFill or
>>>> CellFill.
>>>> This is problem for me because "AreaFill" is producing the following
>>>> message.
>>>>
>>>> fatal:ContourPlotDraw: ARSCAM/ARPRAM - ALGORITHM FAILURE
>>>> fatal:ContourPlotDraw: draw error
>>>> warning:WorkstationDeactivate: workstation not active or not opened
>>>>
>>>> I can avoid this message by setting cnFillMode to RasterFill but
>>>> then
>>>> I cannot use transparency through cnFillOpacityF.
>>>>
>>>> Any suggestion to solve this problem
>>>> Thanks in advance.
>>>>
>>>> Regards
>>>> Nadeem
>>>> _______________________________________________
>>>> ncl-talk mailing list
>>>> List instructions, subscriber options, unsubscribe:
>>>> http://mailman.ucar.edu/mailman/listinfo/ncl-talk
>>>
>> _______________________________________________
>> ncl-talk mailing list
>> List instructions, subscriber options, unsubscribe:
>> http://mailman.ucar.edu/mailman/listinfo/ncl-talk
>
>
>
> ------------------------------
>
> Message: 7
> Date: Fri, 19 Oct 2012 10:49:52 -0600
> From: Dennis Shea <shea@ucar.edu>
> Subject: Re: Cross-section plots
> To: astroqing <astroqing@gmail.com>
> Cc: ncl-talk <ncl-talk@ucar.edu>
> Message-ID: <508184B0.2000605@ucar.edu>
> Content-Type: text/plain; charset=UTF-8; format=flowed
>
> See:
>
> http://www.ncl.ucar.edu/Applications/transect.shtml#ex1
>
> Just change
>
> linint2_points ==> linint2_points_Wrap
>
>
> likely delete these ...
> trans!0 = "z_t"
> trans&z_t = t&z_t
>
> add
> printVarSummary(trans)
>
> so you can see the result
>
>
> On 10/19/2012 08:25 AM, astroqing wrote:
>> Thanks for your reply. I have read the introduction of function linint2_points_Wrap(), but still something i can not understand clearly.
>> So if you can send me an example scripts about how to do arbitrary cross section, I will appreciate it very much.
>> Best wishes!
>>
>> ------------------
>>
>> 2012-10-19
>>
>> -------------------------------------------------------------
>> ????Dennis Shea <shea@ucar.edu>
>> ?????2012-10-19 21:14
>> ????astroqing
>> ???ncl-talk
>> ???Re: [ncl-talk] Cross-section plots
>>
>> Please look at the Examples page:
>> http://www.ncl.ucar.edu/Applications/
>>
>> Under 'Plot Types'
>>
>> Press/height vs. latitude
>> Press/height vs. longitude
>> Press/height vs. time
>>
>> If you need an arbitrary cross section, see
>>
>> http://www.ncl.ucar.edu/Document/Functions/Contributed/linint2_points_Wrap.shtml
>>
>> Cross sections are just regular contour plots wher
>>
>> y -> {height, pressure, depth}
>> x -> {lat,lon,time}
>>
>> ================================================
>>
>> If you are "new to NCL", please read the mini-Language manual at
>>
>> http://www.ncl.ucar.edu/Document/Manuals/
>>
>>
>>
>> On 10/19/12 12:43 AM, astroqing wrote:
>>> Hi,
>>> I am new to NCL and I want to
>>> draw cross-section plots with Ncep Reanalysis data which is in lat/lon
>>> projection.
>>> I only find the sample scripts used to draw WRF output with the
>>> functions wrf_user_intrp3d( ) to interpolate variable horizontally, and
>>> it can not be used in Ncep data.
>>> So I am writing to ask if you can help and tell me how to solve the problem?
>>> Thanks a lot!
>>> Tao Qing
>>> 2012-10-19
>>> ------------------------------------------------------------------------
>>>
>>>
>>> _______________________________________________
>>> ncl-talk mailing list
>>> List instructions, subscriber options, unsubscribe:
>>> http://mailman.ucar.edu/mailman/listinfo/ncl-talk
>>>
>>
>
>
>
> ------------------------------
>
> Message: 8
> Date: Fri, 19 Oct 2012 11:18:55 -0600
> From: Adam Phillips <asphilli@ucar.edu>
> Subject: Re: boxplot
> To: ncl-talk@ucar.edu, nlcheng <cnl88@163.com>
> Message-ID: <50818B7F.6030303@ucar.edu>
> Content-Type: text/plain; charset="iso-8859-1"
>
> Hello,
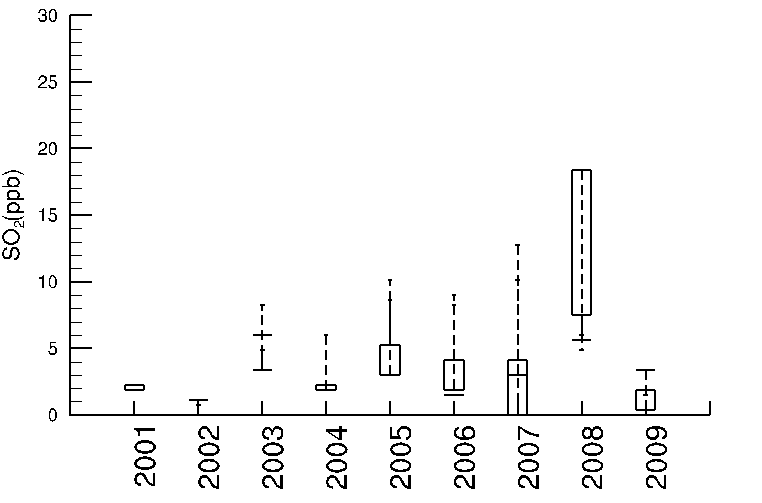
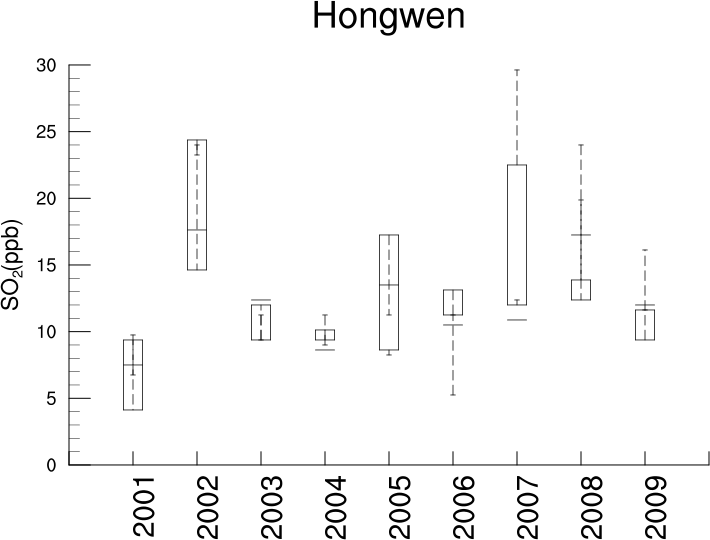
> As I stated yesterday, instead of passing in 5 values per box as the
> documentation states is required, you are passing in 365 values. The box
> plot function wants 5 values in ascending order as is stated in the
> documentation and as is shown in example #1 here:
> http://www.ncl.ucar.edu/Applications/box.shtml#ex1
>
> Modifying some coding from example #1 to simplify it:
>
> yval = new((/2,5/),"float",-999.)
> yval(0,0) = -3.
> yval(0,1) = -1.
> yval(0,2) = 1.5
> yval(0,3) = 4.2
> yval(0,4) = 6.
>
> yval(1,0) = -1.
> yval(1,1) = 0.
> yval(1,2) = 1.
> yval(1,3) = 2.5
> yval(1,4) = 4.
>
> wks = gsn_open_wks("ps","box")
> x = (/-3., -1./)
> plot = boxplot(wks,x,yval,False,False,False)
>
> Note that for box #1 and #2, the values are increasing within the yval
> (0,:) and yval(1,:) arrays. The boxplot function simply plots boxes
> given the input y array values /in the order they are present in the y
> array/.
>
> I am not sure what the data in the file you attached is supposed to
> represent:
>
> 9.75 24 9.375 9 8.25 5.25 12.375 24 11.625
> 4.125 14.625 12 10.125 8.625 11.25 12 12.375 11.625
> 7.5 17.625 12.375 8.625 13.5 10.5 10.875 17.25 12
> 9.375 24.375 9.375 9.375 17.25 13.125 22.5 13.875 9.375
> 6.75 23.25 11.25 11.25 11.25 11.25 29.625 19.875 16.125
> 3.75 28.5 10.125 8.625 14.25 10.5 21.75 16.5 6
> 4.5 26.625 9.375 5.625 10.5 9.375 13.875 14.25 13.125
> 4.875 13.875 12.375 6 12.75 14.625 18.375 18.375 10.875
>
> I ran your code on the input data, and I got the plot that I attached.
> Looking at your input data/coding, you are passing these values in as
> box #1: 9.75, 4.125, 7.5, 9.375, and 6.75. Looking at the first box plot
> in the attached box.png, those values are the ones that are being used
> to draw the box. If you wanted boxplot to draw each boxplot as you
> desire, you would have to input the values /in ascending order/. For
> instance, box #1's values would have to be 4.125, 6.75, 7.5, 9.375, and
> 9.75.
>
> Please look at boxplot example #1 and try modifying/running it so you
> can further understand how the boxplot function works. Adam
>
> On 10/18/2012 09:17 PM, nlcheng wrote:
>> I have uploaded the script and the data .
>> When I run the script it turns out the drawing of boxplot like
>> this
>> but the box is in a mess ; not
>> I do not know what is wrong!
>> hope for your help!
>>
>>
>>
>>
>>
>>
>> _______________________________________________
>> ncl-talk mailing list
>> List instructions, subscriber options, unsubscribe:
>> http://mailman.ucar.edu/mailman/listinfo/ncl-talk
>
> --
> ______________________________________________________________
> Adam Phillips asphilli@ucar.edu
> NCAR/Climate and Global Dynamics Division (303) 497-1726
> P.O. Box 3000
> Boulder, CO 80307-3000 http://www.cgd.ucar.edu/cas/asphilli
>
> -------------- next part --------------
> An HTML attachment was scrubbed...
> URL: http://mailman.ucar.edu/pipermail/ncl-talk/attachments/20121019/2035f67b/attachment.html
> -------------- next part --------------
> A non-text attachment was scrubbed...
> Name: not available
> Type: image/png
> Size: 6400 bytes
> Desc: not available
> Url : http://mailman.ucar.edu/pipermail/ncl-talk/attachments/20121019/2035f67b/attachment.png
> -------------- next part --------------
> A non-text attachment was scrubbed...
> Name: not available
> Type: image/png
> Size: 726 bytes
> Desc: not available
> Url : http://mailman.ucar.edu/pipermail/ncl-talk/attachments/20121019/2035f67b/attachment-0001.png
> -------------- next part --------------
> A non-text attachment was scrubbed...
> Name: box.png
> Type: image/png
> Size: 13503 bytes
> Desc: not available
> Url : http://mailman.ucar.edu/pipermail/ncl-talk/attachments/20121019/2035f67b/attachment-0002.png
>
> ------------------------------
>
> Message: 9
> Date: Fri, 19 Oct 2012 12:25:12 -0500
> From: Ke Deng <kdeng1@slu.edu>
> Subject: how to use loop to read in multiple nc files
> To: ncl-talk@ucar.edu
> Message-ID:
> <CAJMcDnD6HEY+T1WWW3jPrryG34e6w-oK2x8L8+ULS-084BAfug@mail.gmail.com>
> Content-Type: text/plain; charset="iso-8859-1"
>
> Dear all,
> I am computing the vertical integrated moisture transport (this is not the
> point) and get the right code for that. But now I meet with one problem.
> The data I use now are rhum.****.nc uwnd.****.nc vwnd.****.nc yearly
> data.(60 nc files for each one so 180 nc files totally) The below code is
> useful for one year data so the code is absolutely right. But now I want to
> compute the moisture transport over 60 years (1948-2007). At first I used
> the ncrcat command in linux to integrate the 60 nc files into one file but
> when I run the code it displayed the segmentation fault. And then I used
> the command systemfunc and addfiles in ncl to process that and also show
> some errors. So the only reason is there are too many files and the
> software can not see them as one big file to process. Now I am stuck here
> and don't know how to write one loop to solve that. Please your response
> will be appreciated! Thank u!
>
> ;***********************************************
> load "$NCARG_ROOT/lib/ncarg/nclscripts/csm/gsn_code.ncl"
> load "$NCARG_ROOT/lib/ncarg/nclscripts/csm/gsn_csm.ncl"
> load "$NCARG_ROOT/lib/ncarg/nclscripts/csm/contributed.ncl"
> ;***********************************************
> ;begin
> ;***********************************************
> ;read in netCDF file
> ;***********************************************
> f1 = addfiles("rhum.1977.nc","r")
> f2 = addfiles("uwnd.1977.nc","r")
> f3 = addfiles("vwnd.1977.nc","r")
> rhum = f1->rhum(:,:,:,:)
> q = rhum/100+302.66
> copy_VarCoords(rhum,q)
> uwnd = f2->uwnd(:,0:7,:,:)
> u = uwnd/100+202.66
> copy_VarCoords(uwnd,u)
> vwnd = f3->vwnd(:,0:7,:,:)
> v = vwnd/100+202.66
> copy_VarCoords(vwnd,v)
>
> qu=q*u
> qv=q*v
> copy_VarCoords(q,qu)
> copy_VarCoords(q,qv)
>
> g = 9.81
> q = qu+qv
> copy_VarCoords(qu,q)
>
> qint = dim_sum_Wrap(q(time|:,lat|:,lon|:,level|:)) ;*integration*******
> Qint = dim_sum_Wrap(qint(lat|:,lon|:,time|:))
> Qint = (Qint/g) ;***********weight by gravity****************
> Qint@units = "kg/ms"
> ;************************************
> ; create the plot1
> ;************************************
> wks=gsn_open_wks("ps","q")
>
> res = True ; plot mods desired
> res@tiMainString = "vertical integrated moisture transport" ;
> main title
> res@cnFillOn = True ; turn on color fill
> plot = gsn_csm_contour_map(wks,Qint(:,:),res)
>
> end
> -------------- next part --------------
> An HTML attachment was scrubbed...
> URL: http://mailman.ucar.edu/pipermail/ncl-talk/attachments/20121019/c69029a6/attachment.html
>
> ------------------------------
>
> Message: 10
> Date: Fri, 19 Oct 2012 09:55:24 -0800
> From: Soumik Basu <sbasu@iarc.uaf.edu>
> Subject: Re: how to use loop to read in multiple nc files
> To: <ncl-talk@ucar.edu>
> Message-ID: <42c2c61147d6f88cddc200ab8806e621@arthur.iarc.uaf.edu>
> Content-Type: text/plain; charset=UTF-8; format=flowed
>
> You can try something like this :
>
> ***********************************************
> load "$NCARG_ROOT/lib/ncarg/nclscripts/csm/gsn_code.ncl"
> load "$NCARG_ROOT/lib/ncarg/nclscripts/csm/gsn_csm.ncl"
> load "$NCARG_ROOT/lib/ncarg/nclscripts/csm/contributed.ncl"
> ;***********************************************
> ;begin
> ;***********************************************
> ;read in netCDF file
> ;***********************************************
>
> do yy = 1948, 2007 ; Start the year loop
>
> f1 = addfiles("rhum."+yy+".nc","r")
> f2 = addfiles("uwnd."+yy+".nc","r")
> f3 = addfiles("vwnd."+yy+".nc","r")
> rhum = f1->rhum(:,:,:,:)
> q = rhum/100+302.66
> copy_VarCoords(rhum,q)
> uwnd = f2->uwnd(:,0:7,:,:)
> u = uwnd/100+202.66
> copy_VarCoords(uwnd,u)
> vwnd = f3->vwnd(:,0:7,:,:)
> v = vwnd/100+202.66
> copy_VarCoords(vwnd,v)
>
> qu=q*u
> qv=q*v
> copy_VarCoords(q,qu)
> copy_VarCoords(q,qv)
>
> g = 9.81
> q = qu+qv
> copy_VarCoords(qu,q)
>
> qint = dim_sum_Wrap(q(time|:,lat|:,lon|:,level|:))
> ;*integration*******
> Qint = dim_sum_Wrap(qint(lat|:,lon|:,time|:))
> Qint = (Qint/g) ;***********weight by
> gravity****************
> Qint@units = "kg/ms"
>
> end do ; end year loop
>
> ;************************************
> ; create the plot1
> ;************************************
> wks=gsn_open_wks("ps","q")
>
> res = True ; plot mods desired
> res@tiMainString = "vertical integrated moisture transport"
> ; main title
> res@cnFillOn = True ; turn on color fill
> plot = gsn_csm_contour_map(wks,Qint(:,:),res)
>
> end
>
>
> On 2012-10-19 09:25, Ke Deng wrote:
>> Dear all,
>> I am computing the vertical integrated moisture transport (this is
>> not the point) and get the right code for that. But now I meet with
>> one problem. The data I use now are rhum.****.nc uwnd.****.nc
>> vwnd.****.nc yearly data.(60 nc files for each one so 180 nc files
>> totally) The below code is useful for one year data so the code is
>> absolutely right. But now I want to compute the moisture transport
>> over 60 years (1948-2007). At first I used the ncrcat command in
>> linux
>> to integrate the 60 nc files into one file but when I run the code it
>> displayed the segmentation fault. And then I used the command
>> systemfunc and addfiles in ncl to process that and also show some
>> errors. So the only reason is there are too many files and the
>> software can not see them as one big file to process. Now I am stuck
>> here and don't know how to write one loop to solve that. Please your
>> response will be appreciated! Thank u!
>>
>> ;***********************************************
>> load "$NCARG_ROOT/lib/ncarg/nclscripts/csm/gsn_code.ncl"
>> load "$NCARG_ROOT/lib/ncarg/nclscripts/csm/gsn_csm.ncl"
>> load "$NCARG_ROOT/lib/ncarg/nclscripts/csm/contributed.ncl"
>> ;***********************************************
>> ;begin
>> ;***********************************************
>> ;read in netCDF file
>> ;***********************************************
>> f1 = addfiles("rhum.1977.nc [2]","r")
>> f2 = addfiles("uwnd.1977.nc [3]","r")
>> f3 = addfiles("vwnd.1977.nc [4]","r")
>> rhum = f1->rhum(:,:,:,:)
>> q = rhum/100+302.66
>> copy_VarCoords(rhum,q)
>> uwnd = f2->uwnd(:,0:7,:,:)
>> u = uwnd/100+202.66
>> copy_VarCoords(uwnd,u)
>> vwnd = f3->vwnd(:,0:7,:,:)
>> v = vwnd/100+202.66
>> copy_VarCoords(vwnd,v)
>>
>> qu=q*u
>> qv=q*v
>> copy_VarCoords(q,qu)
>> copy_VarCoords(q,qv)
>>
>> g = 9.81
>> q = qu+qv
>> copy_VarCoords(qu,q)
>>
>> qint = dim_sum_Wrap(q(time|:,lat|:,lon|:,level|:))?
>> ;*integration*******
>> Qint = dim_sum_Wrap(qint(lat|:,lon|:,time|:))
>> Qint = (Qint/g)??????????? ;***********weight by
>> gravity****************
>> Qint@units = "kg/ms"
>> ;************************************
>> ;? create the plot1
>> ;************************************
>> wks=gsn_open_wks("ps","q")
>>
>> res????????????????????? = True?????????????? ; plot mods desired
>> res@tiMainString???????? = "vertical integrated moisture
>> transport"??? ; main title
>> res@cnFillOn???????????? = True?????????????? ; turn on color fill
>> plot = gsn_csm_contour_map(wks,Qint(:,:),res)
>>
>> end
>>
>>
>>
>> Links:
>> ------
>> [1] http://rhum.1977.nc
>> [2] http://uwnd.1977.nc
>> [3] http://vwnd.1977.nc
>>
>> _______________________________________________
>> ncl-talk mailing list
>> List instructions, subscriber options, unsubscribe:
>> http://mailman.ucar.edu/mailman/listinfo/ncl-talk
>
> --
> "Numbing the pain for a while will make it worse when you finally feel
> it.
> ~J.K. Rowling"
> *****************************************
> Soumik Basu
> Graduate Student, Research Assistant
> International Arctic Research Center
> University of Alaska Fairbanks
> Fairbanks,Alaska,USA
> *****************************************
>
>
> ------------------------------
>
> _______________________________________________
> ncl-talk mailing list
> ncl-talk@ucar.edu
> http://mailman.ucar.edu/mailman/listinfo/ncl-talk
>
>
> End of ncl-talk Digest, Vol 107, Issue 27
> *****************************************
_______________________________________________
ncl-talk mailing list
List instructions, subscriber options, unsubscribe:
http://mailman.ucar.edu/mailman/listinfo/ncl-talk
Received on Fri Oct 19 12:04:05 2012
This archive was generated by hypermail 2.1.8 : Tue Oct 23 2012 - 11:10:04 MDT