Date: Mon Oct 29 2012 - 16:53:19 MDT
Hi NCL,
That is a pretty good looking plot of merged data! However, note that you
> have included some areas with missing 2-D coordinates, which I previously
> warned about. So you can't really trust what you see yet. Notice the
> small streak next to southern Nova Scotia; this is an example of streaking
> due to missing coordinates.
>
> Those tiles on the north look like a different problem. Please look at
> the Daymet original tiles for 48-50N, using your version of
> plot.daymet-orig.ncl, and see if they have the same discontinuities as what
> you see in the merged plot. Make sure that you are looking at the same
> date for each tile.
>
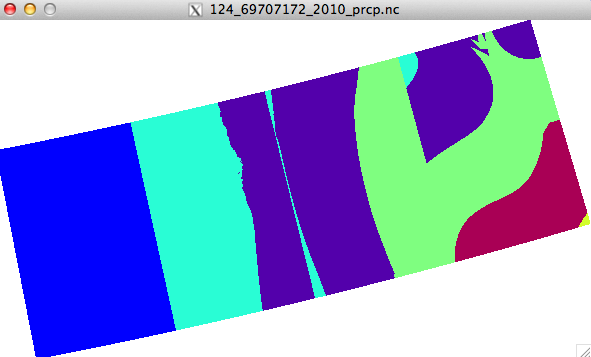
I just looked at the files(48-50N), they are files that extended into
Canada, the file No. are 12469-12478. However, they looked normal
using plot.daymet-orig.ncl, I just do the joining for 4 tiles, they
looked discontinuities like this(I used ncview for showing here):
[image: Inline image 1]
Is this just the problem of the data(I am thinking it may not related to
the joining script)?
Thanks a lot,
Ping
> --Dave
>
> On Mon, Oct 29, 2012 at 7:00 AM, Ping Yang <pyang@ccny.cuny.edu> wrote:
>
>> Thanks, I just increased the *wsMaximumSize to 50000000 and now it works!
>>
>
> <image removed, see previous message, Oct. 29>
>
>
>> Look at the Upper North of this data, some unexpected strips near the
>> edge of north, the data looks strange! I am not sure it is because of the
>> joining or the plotting.
>>
>> I can upload this file to the ftp if you want have a look.
>>
>> Thanks,
>>
>> Ping
>>
>>
>> On Sun, Oct 28, 2012 at 10:31 PM, Dennis Shea <shea@ucar.edu> wrote:
>>
>>> A good place to look when and error is encountered
>>> is the FAQ: http://www.ncl.ucar.edu/FAQ/
>>>
>>> Search for 'Workspace reallocation'
>>>
>>> ====
>>> setvalues NhlGetWorkspaceObjectId()
>>> "wsMaximumSize" : 100000000
>>> end setvalues
>>>
>>>
>>>
>>> On 10/28/12 7:54 PM, Ping Yang wrote:
>>>
>>>> Hi NCL,
>>>>
>>>> I tested the new script several times and I found it still didn't fix
>>>> the problem. I then exclude the tile 11937 and 11938 and it works well
>>>> both with the previous script and the updated one.
>>>>
>>>> A problem came to the plotting, which I subset a day (e.g. April 8 2010)
>>>> and the plotting looks like this(no color filled in the map):
>>>> Inline image 1
>>>> I used a printVarsummary(x) for the variable information.
>>>> Variable: x
>>>> Type: float
>>>> Total Size: 11613888 bytes
>>>> 2903472 values
>>>> Number of Dimensions: 2
>>>> Dimensions and sizes:[y | 1872] x [x | 1551]
>>>> Coordinates:
>>>> Number Of Attributes: 7
>>>> time :11055.5
>>>> long_name :daily total precipitation
>>>> units :mm/day
>>>> coordinates :lon lat
>>>> _FillValue :-9999
>>>> valid_range :( 0, 200 )
>>>> cell_methods :area: sum time: sum
>>>>
>>>> and here gave out the error information:
>>>> warning:Attempt to reference attribute (date) which is undefined
>>>> fatal:ContourPlotDraw: Workspace reallocation would exceed maximum size
>>>> 32556688
>>>> fatal:ContourPlotDraw: draw error
>>>> warning:WorkstationDeactivate: workstation not active or not opened
>>>> fatal:ContourPlotDraw: Workspace reallocation would exceed maximum size
>>>> 32556688
>>>> fatal:ContourPlotDraw: draw error
>>>> warning:WorkstationDeactivate: workstation not active or not opened
>>>>
>>>> How can I fix this(Workspace reallocation exceed maximum size)?
>>>>
>>>> Thanks,
>>>>
>>>> Ping
>>>>
>>>>
_______________________________________________
ncl-talk mailing list
List instructions, subscriber options, unsubscribe:
http://mailman.ucar.edu/mailman/listinfo/ncl-talk