Date: Mon Feb 10 2014 - 12:37:53 MST
Hi Paula,
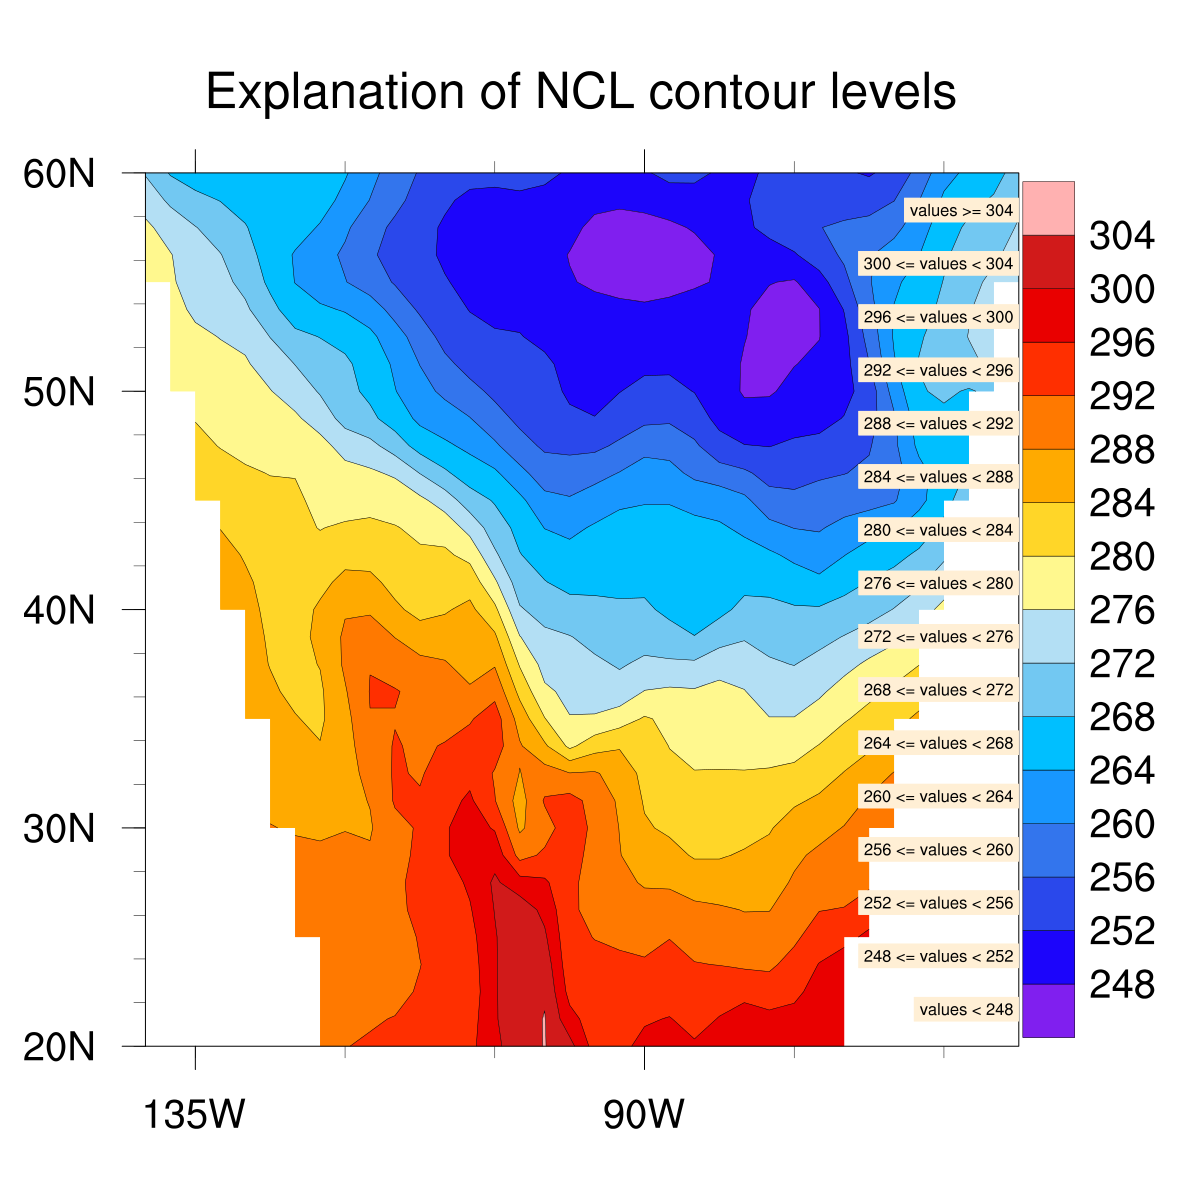
If you don't modify the labels, then these values mean:
0 > white >= 0.2
See the attached sample contour plot which graphically shows what the contour levels mean.
--Mary
On Feb 10, 2014, at 11:07 AM, Paula Doubrawa <pdoubraw@indiana.edu> wrote:
> Hello, Mary
>
> Thank you very much for your thorough response. I have given up on using gsn_contour_shade and decided to just specify the exact colors using cnFillColors.
>
> On a labelbar that looks like the attached one (InteriorEdges), which does the white color represent?
>
> 0 > white >= -0.2
>
> or
>
> 0 >= white > -0.2 ?
>
> Thank you again
> Paula
>
>
> On Fri, Feb 7, 2014 at 6:50 PM, Mary Haley <haley@ucar.edu> wrote:
> Hi Paula,
>
> It would help if you could provide a sample image, or describe in more detail what your two sets of contours look like. For example, is the first plot a filled contour plot, and the second plot shaded contours? Or are they both shaded contours?
>
> Also, how are you drawing the two plots on top of each other? Are you using "overlay"?
>
> It sounds like at least one of the plots must be a color contour plot, so perhaps you need to play with making some of the colors transparent or partially transparent via the "cnFillOpacityF" resource, or by using an RGBA array for your contour fill, where you can set the "A" values as needed to create transparency.
>
> To see some examples of this, see examples newcolor_5.ncl and newcolor_17.ncl at:
>
> http://www.ncl.ucar.edu/Applications/rgbacolor.shtml
>
> You might also look at newcolor_10.ncl, which has two color contour plots overlaid, and it uses "read_colormap_file" and "cnFillPalette" to first read in the desired color table as an RGBA array, sets one of the colors to be fully transparent (the first color), and then sets this new color map using cnFillPalette.
>
> If none of the above helps, the we will need more details about how you are creating your plot, and/or a sample image.
>
> Thanks,
>
> --Mary
>
> On Feb 7, 2014, at 12:16 PM, Paula Doubrawa <pdoubraw@indiana.edu> wrote:
>
> > Hello,
> >
> > I am using gsn_contour_shade on top of a gsn_csm_contour_map plot and the shading is hiding whatever contours were drawn by the previous function.
> >
> > I am setting
> >
> > res@gsnDraw = False
> > res@gsnFrame = False
> >
> > as recommended and I have also tried playing around with the draw order but no success.
> >
> > Any hints??
> >
> > Thank you!
> > Paula
> > _______________________________________________
> > ncl-talk mailing list
> > List instructions, subscriber options, unsubscribe:
> > http://mailman.ucar.edu/mailman/listinfo/ncl-talk
>
>
> <Screen Shot 2014-02-10 at 1.02.55 PM.png>_______________________________________________
> ncl-talk mailing list
> List instructions, subscriber options, unsubscribe:
> http://mailman.ucar.edu/mailman/listinfo/ncl-talk
_______________________________________________
ncl-talk mailing list
List instructions, subscriber options, unsubscribe:
http://mailman.ucar.edu/mailman/listinfo/ncl-talk
- application/octet-stream attachment: contour1d_levels.ncl