Date: Sat Feb 22 2014 - 15:57:08 MST
Thanks Will,
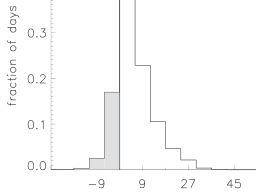
Actually I want to shade the region where xx <0 with ACTIVE
"res@gsnXYBarChartOutlineOnly = True".
so that I'll get the plot as i attached here, but I still do not figure it
out in ncl..
On Sun, Feb 23, 2014 at 7:25 AM, Will Hobbs <Will.Hobbs@utas.edu.au> wrote:
> Erika
>
> Replace 'gsFillColor' with 'gsnXYBarChartColors'
>
> Will
> From: Erika Folova <e.folova@gmail.com>
> Date: Sunday, 23 February 2014 9:17 AM
> To: Will Hobbs <will.hobbs@utas.edu.au>
> Cc: NCL-talk <ncl-talk@ucar.edu>
> Subject: Re: gsnXRefLine
>
> Hi Will,
>
> I have no Idea why I got this error: *warning:gsFillColor is not a
> valid resource*,
> my plot resources are:
>
> res = True
> res@gsnDraw = False
> res@gsnFrame = False
> res@xyLineThicknesses = 2.0
> res@xyLineColors = "blue"
> ;res@xyMonoDashPattern = False
> res@gsnXYBarChart = True
> res@gsnXYBarChartOutlineOnly = True ;(even if i set this "False"
> still produced the same error)
>
> res@tmXBMode = "Explicit"
> res@tmXBValues = (/-5,-4,-3,-2,-1,0,1,2,3,4,5,6,7/)
> res@tmXBLabels = (/-5,-4,-3,-2,-1,0,1,2,3,4,5,6,7/)
> res@tmXMajorGrid = True
> res@tmXMajorGridThicknessF = 1.0 ; 2.0 is default
> res@tmXMajorGridLineDashPattern = 2 ; select short dash
> lines
> res@tmYMajorGrid = True ; implement y grid
> res@tmYMajorGridThicknessF = 1.0 ; 2.0 is default
> res@tmYMajorGridLineDashPattern = 2 ; select short dash
> lines
>
>
> * res@gsnXRefLine = 0.0 *
> * res@gsnXRefLineThicknessF = 3.0*
> * cols = where(yy.lt.0, "blue", "red") *
> res@gsFillColor = cols
>
> plotD = gsn_csm_xy (wks, xx, yy, res)
>
>
>
> Thank you Will,
> Erika
>
>
>
> On Sun, Feb 23, 2014 at 7:02 AM, Will Hobbs <Will.Hobbs@utas.edu.au>wrote:
>
>> Erika
>>
>> Have you looked at the histogram examples on the NCL help files? There
>> aren't any examples that do exactly what you want, but there should be
>> enough there to pint you in the right direction
>>
>> http://www.ncl.ucar.edu/Applications/histo.shtml
>>
>> I can think of two ways of doing what you what. The first would be to
>> plot values below zero and above zero separately with different colors (use
>> the gsFillColor resource), and then overlay.
>>
>> The second, probably easier way, would be to set up an array of fill
>> colors the same size as the 'x' array.
>>
>> > cols = where(xx.lt.0, "blue", "red") ; new array of size Nbin,
>> where Nbin is the number of bins. Blue where xx is less than 0, red
>> otherwise
>> > res@gsFillColor = cols
>>
>> > plotD = gsn_csm_xy (wks, xx, yy, res)
>>
>> Good luck
>>
>> Will
>>
>>
>> From: Erika Folova <e.folova@gmail.com>
>> Date: Saturday, 22 February 2014 9:09 PM
>> To: NCL-talk <ncl-talk@ucar.edu>
>> Subject: gsnXRefLine
>>
>> NCL,
>>
>> I am wondering whethere there is a function that works similar like
>> res@gsnAboveYRefLineColor or res@gsnBelowYRefLineColor but for
>> gsnXRefLine?
>> I would like to shade my histogram with gray for the value lower than
>> zero:
>>
>> e.g.
>>
>> [SNIP]
>>
>> res = True
>> res@gsnDraw = False
>> res@gsnFrame = False
>> res@xyLineThicknesses = 2.0
>> res@xyLineColors = "blue"
>> res@xyMonoDashPattern = False ; all solid
>> res@tiYAxisString = "PDF (%) "
>> res@tiXAxisString = "PC "
>> res@gsnXYBarChart = True ; Create bar plot
>> ;res@gsnXYBarChartOutlineOnly = True
>>
>> res@trXMinF = -5.0 ; min value on y-axis
>> res@trXMaxF = 7.0
>> res@trYMinF = 0.0 ; min value on y-axis
>> res@trYMaxF = 10.0
>> res@vpHeightF= 0.3 ; change aspect ratio of plot
>> res@vpWidthF = 0.90
>>
>>
>> res@tmXBMode = "Explicit"
>> res@tmXBValues = (/-5,-4,-3,-2,-1,0,1,2,3,4,5,6,7/)
>> res@tmXBLabels = (/-5,-4,-3,-2,-1,0,1,2,3,4,5,6,7/)
>> res@tmXMajorGrid = True
>> res@tmXMajorGridThicknessF = 1.0 ; 2.0 is default
>> res@tmXMajorGridLineDashPattern = 2 ; select short dash
>> lines
>> res@tmYMajorGrid = True ; implement y grid
>> res@tmYMajorGridThicknessF = 1.0 ; 2.0 is default
>> res@tmYMajorGridLineDashPattern = 2 ; select short dash
>> lines
>>
>> res@vpXF = 0.07 ; position and size
>> res@vpYF = 0.45
>>
>>
>> res@tiMainFontHeightF = 0.018
>> res@tmXBLabelFontHeightF = 0.014
>> res@tmYLLabelFontHeightF = 0.014
>>
>> * res@gsnXRefLine = 0.0 *
>> * res@gsnXRefLineThicknessF = 3.0*
>> * res@gsnRightXRefLineColor = "red" ; above ref line fill red*
>> * res@gsnLeftXRefLineColor = "blue"*
>>
>> plotD = gsn_csm_xy (wks, xx, yy, res)
>>
>> ---
>>
>> Thanks
>>
>> Erika
>>
>>
>> _______________________________________________
>> ncl-talk mailing list
>> List instructions, subscriber options, unsubscribe:
>> http://mailman.ucar.edu/mailman/listinfo/ncl-talk
>>
>>
>
_______________________________________________
ncl-talk mailing list
List instructions, subscriber options, unsubscribe:
http://mailman.ucar.edu/mailman/listinfo/ncl-talk