Date: Fri Feb 21 2014 - 12:30:49 MST
Hi all,
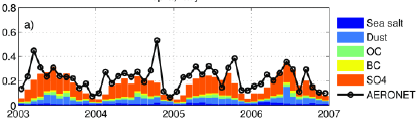
I want to make a plot like the attached one, It is easy to make the black
curve using XY plot, the question is how to add the filled curves? Can
anybody direct me where to find an example?
Thanks in advance.
[image: Inline image 2]
_______________________________________________
ncl-talk mailing list
List instructions, subscriber options, unsubscribe:
http://mailman.ucar.edu/mailman/listinfo/ncl-talk